AI could reshape the pathways to economic growth. Those looking to grow will adapt to that. Predictions of our economic futures should account for both.

Three years ago, workers in Kenya made international headlines for the conditions they experienced while labeling data for OpenAI. These workers spent their days sorting through hate speech, sexual abuse and violent images — some of the most disturbing material on the internet — for around $1.35 an hour. The labels they produced were then used to help train ChatGPT to identify toxic or disallowed content.

In 2023, much of the outrage was focused — rightly — on the working conditions of these data labelers. But revisited in 2026, this story takes on another dark cast. 

Amid a new wave of AI anxiety, people have begun to fear that the broader category of IT service jobs may disappear entirely. Under this view, by helping to train ChatGPT, these workers may have inadvertently been helping to automate away the very kind of tradable service work they performed, narrowing Kenya’s path to prosperity. 

But how much evidence is there that AI-related displacement has actually begun in developing countries? And how should we forecast what comes next when the workers, firms and countries affected by AI will themselves adapt, improvise and change in response?

Climbing the Growth Ladder

Historically, manufacturing growth has been the path for countries out of poverty. In Japan, South Korea, Taiwan and, most spectacularly, China, the expansion of export manufacturing pulled millions of people from the farms to better-paying jobs in factories. Under the pressure of international competition, East Asian firms quickly converged to the technological frontier.

But, outside of a few bright spots like Vietnam and Bangladesh, developing countries have largely failed to replicate the success of East Asia. In India, the manufacturing share of GDP has never exceeded 20% and has even declined since 2010. In sub-Saharan Africa, manufacturing makes up around 10% of GDP. New analysis suggests that over the past 30 years, manufacturing productivity in the poorest countries has stubbornly remained far below the global frontier.

Enter IT services.

The arrival of cheap broadband across the world made the outsourcing of information technology services viable for Western companies, enabling them to take advantage of cheaper labor in developing countries. In 1999, India deregulated its telecom sector, accelerating the adoption of high-speed internet and allowing new firms like Infosys and Wipro to become highly profitable. A new sector — in India, “business process outsourcing” (BPO) — was born.

For countries struggling to get growth off the ground, BPO seemed like a lifeline. Like the export manufacturing jobs of yore, export services held out the promise of generating significant foreign exchange revenue while also creating a large number of better-paying jobs. In 2021, the World Bank published a report extolling “the promise of services-led development,” highlighting their exposure to “innovation that improves labor productivity.”

Over the past few decades, countries like the Philippines and Brazil have developed sizable IT sectors, exporting billions of dollars of services a year and employing close to 2 million workers apiece.1 But, globally, the clear leader of the pack was India, whose IT services sector employed 5.8 million people and exported $200 billion in 2025:
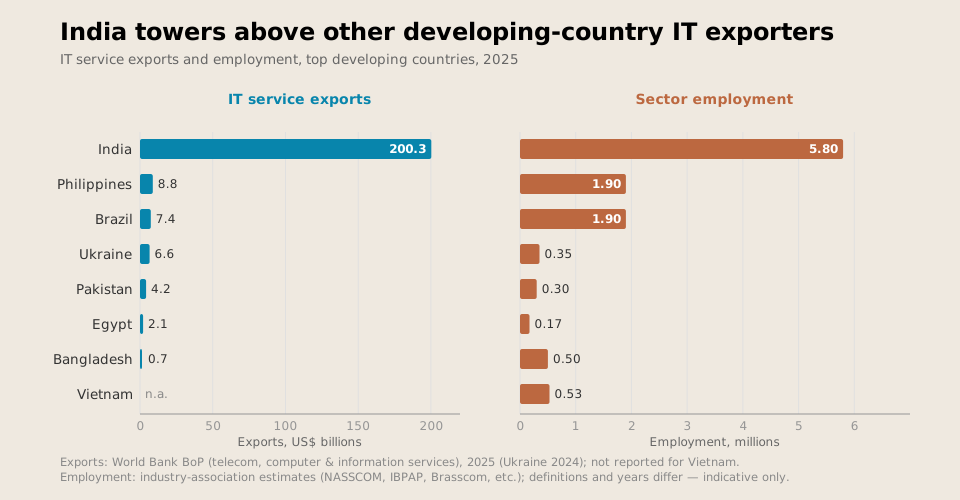
Graph showing much higher employment in the IT export sector in India than in any other country
India is patient zero for any changes to the IT export sector.

The fear of AI replacing human jobs is now ubiquitous. In America, attention has become fixed on the disruption of entry-level jobs in software development and customer service — the proverbial canaries in the coal mine, the work that should (at least in theory) be most easily automatable by AI coding agents. An influential paper by economists Erik Brynjolfsson, Bharat Chandar and Ruyu Chen found that early career workers (22-25-year-olds, in the U.S.) in the most AI-exposed sectors have seen a 19% relative decline in their employment since 2022. 

Naturally, attention has started to shift to AI’s implications for the 6.8 billion people who live in low- and middle-income countries. Thus far, AI has not had much of an impact, positive or negative, on the 2.5 billion people who still depend on smallholder farming. In manufacturing, the evidence for impact is also limited, though perhaps AI-induced advances in industrial robotics are coming down the pike. It is in service exports that the threat of AI-related job displacement looms the largest. 

The Canaries in the Coal Mine

It has now been four years since the launch of ChatGPT. Agents are able to do much of the work of customer service; indeed, corporate support lines have been increasingly replaced with a ChatGPT or Claude wrapper. So how much is automation already displacing service exports in the developing world?

We can take a page from the recent research on AI-exposed displacement by Brynjolfsson et al. in the United States and look at how employment is evolving for the people we’d expect to be most exposed to AI displacement: entry-level tech workers.2

Perhaps the best available data from any developing country comes from India’s Periodic Labour Force Survey (PLFS), a high-frequency look at trends in employment and wages.3 We can use what economists call a “triple difference” to pinpoint the effect of AI exposure. First, we take employment for young workers (those 15-24 years old) in AI-exposed industries and subtract the trend for older workers (those 25-39) in the same industries. Then we can do the same comparison of young versus old in industries largely insulated from AI. Last, by taking the difference between these two differences, we can isolate the shock to entry-level work in the industries most exposed to AI.
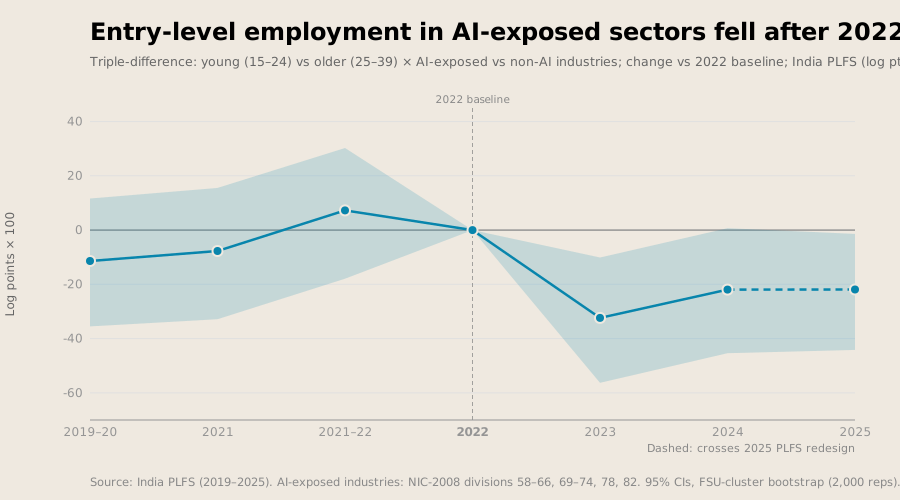
Chart showing a fall in IT sector employment after the launch of ChatGPT
Employment of entry-level IT workers has fallen after the launch of ChatGPT. Analysis of PLFS data by the authors.

The chart above shows this triple difference on employment, with confidence intervals marked by the vertical bars. For the three years before ChatGPT, there was little gap between entry-level and older workers in the most AI-exposed and non-exposed industries. But after 2022 — the year ChatGPT was released to the public — relative employment for the youngest, AI-exposed workers suddenly fell 32%. Relative employment has not recovered since, remaining around 20% below the 2022 baseline in the latest 2025 snapshot.
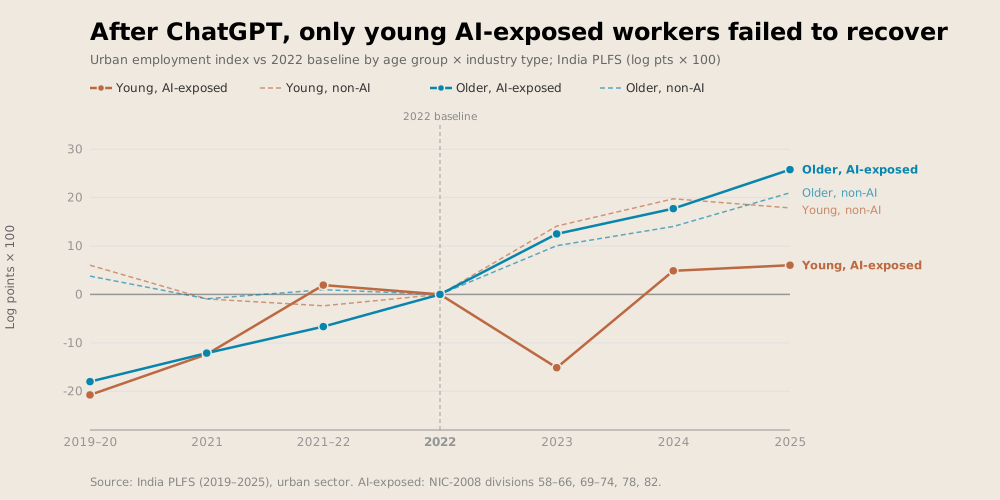
Chart showing young AI-exposed workers are still below trend for employment
Employment for other workers has rebounded since 2022, but entry-level IT worker employment remains below trend. Analysis by the authors.

We should be careful about overreading this result. It’s possible that the decline reflects structural forces that were occurring at the same time as the rise of generative AI. For instance, some Indian IT firms overhired during the pandemic and froze graduate hiring in 2023.

The absence of a robust employment recovery — amid rhetoric from the BPO companies themselves about increasing AI adoption — gives a hint that the effect may be real. Incidentally, this echoes the result in the latest revision of the work by Brynjolfsson and his coauthors, where the 19% drawdown in employment for AI-exposed young workers has shown no sign of disappearing.

But we should not take this as a sign that all the jobs are going away. This data is from one sector, in one country, among those workers we expect to be most affected. There is (as yet) no evidence of a generalized downturn across all age categories or AI-exposed sectors. Even this result is barely statistically distinguishable from zero.

How and when can we draw clearer conclusions? It may be longer than we’d like — in most other developing countries, data comes with far more of a lag.

Flying Blind Since Takeoff

“Gentlemen, you have come 60 days too late. The depression is over.” Herbert Hoover, June 19304

In 1930, the Depression was very much not over. But how was Hoover to know? This was before Kuznets’ “National Income” report was presented in 1934, the precursor to modern national income accounts and GDP. It was also before reliable monthly unemployment statistics were available, as the modern household survey did not begin until 1940.

Many of today’s leaders, particularly in low- and middle-income countries, find themselves in a similar position to Hoover in the 1930s — entering a period of economic transformation blind to how their economies are actually changing in real time. India’s PLFS is a remarkable effort, and one for which there is no equivalent in other countries that might be similarly vulnerable to an IT exports shock.

Take the Philippines, another country with a significant service export sector. Their annual survey of business and industry is released more than one year after the period it studies. This makes it nearly useless in analyzing high-frequency labor force changes in response to changes in AI capabilities. It might not be until Fable 8 is released that we can fully disentangle the impact of Fable 5 (and today’s other frontier models) on the Philippines IT sector’s labor force. There simply is no real-time tracking data.5

With the attention and money now flowing to AI economics research, we are likely to be bombarded with similar estimates to our own, from hot-off-the-press working paper abstracts that tell us how AI has displaced some category of worker relative to another or boosted productivity in some company relative to another. 

So it will also be tempting to overread the data we do have — to dash off a Twitter thread that launches into the coming employment apocalypse facing India’s young IT workers. But each result is only one piece of the puzzle. This result — and others like it — don’t tell us about overall impacts.

And then, there’s only the small matter of projecting this out into the future. Even if we could perfectly understand economies today, simply extrapolating that out to meet the capabilities of tomorrow’s models could lead us to highly misleading forecasts.

Not-So-Dumb Farmers and the Population Bomb That Wasn’t

Many of the fears about AI’s economic effects arise from projecting the effects of future technologies on a world that looks broadly similar to the one today. But these kinds of extrapolations have a long and checkered history, as we humans tend to be far more adaptable than we give ourselves credit for.

Perhaps the most infamous prediction in international development comes from Paul Ehrlich’s 1968 bestseller “The Population Bomb.” Extrapolating out observed trends in population growth and limited progress in food production, Ehrlich was alarmed by the possibility of overpopulation and mass starvation. The most optimistic scenario presented in “The Population Bomb,” which required “a maturity of outlook and behavior in the United States that seems unlikely to develop,” involved the death by starvation of half a billion people (one-fifth of the world’s population).6

But Ehrlich’s projections were based on static extrapolations of human behavior. He failed to anticipate the Green Revolution, which dramatically improved grain yields (particularly in India), and the Demographic Transition, in which fertility fell. Deaths from malnutrition and famines have actually decreased. Ehrlich bet against our oft-underappreciated ability to innovate and adapt, by imposing a rapidly growing population onto a future world whose productive possibilities changed too slowly. 

Indeed, the Y2K episode,7 the demand shock that supercharged India’s IT export sector, is another example of predictions not holding up to adaptation. This time, before the clock struck midnight on December 31, 1999, adaptation came in the form of coders in India inspecting and modifying millions of lines of code in order to avert disaster. In the end, apocalyptic predictions of financial, government and transport systems simultaneously crashing across the globe never came to pass, as we adapted to ensure they didn’t.

Climate economics, too, has learned a similar lesson over recent decades. Early models of the agricultural damage from climate change often took projected temperatures, ran them through equations of crop yields at different temperatures and projected out damages. Predictably, the estimated climate damages in this early generation of predictions tended to be enormous. But these models baked in the critical assumption that farmers would not adapt to a changing climate.

There will still, of course, be large costs from climate change. And not all adaptations are successful: In U.S. agriculture, adaptations over the long run have mitigated at most half, but most likely none, of the damages from climate change. There are real constraints to adaptation — even where there is a will to adapt, there is not necessarily a way to do so.

AI may play out the same way as these previous challenges. There will likely be losers from adaptation. There may even be thresholds at which the ability to adapt runs out. But if you are guesstimating what the world will look like in five or 10 years’ time, you may end up being very wrong if you neglect our future selves’ ability to adapt. Tomorrow’s AI will meet tomorrow’s world, not today’s.

This points us to one small but perhaps constructive suggestion for economists. For the past 20 years, causal inference — the ability to cleanly separate cause and effect — has been the sine qua non of academic economic research. By contrast, forecasting has been relegated to secondary or tertiary status, the domain of policy people and (shudder) bankers. 

That division of labor made sense when we could reasonably expect that the world of tomorrow resembled the world of today. But if AI really is about to reshape the pathways to growth, the most useful thing economists can do is not to measure yesterday’s shock ever more precisely but to get better at predicting the next one.

More accurate visions of our economic futures must account for both machines’ capabilities and humans’ adaptabilities. Just as humanity didn’t sit around waiting to starve, business executives at Infosys are not sitting around waiting to be replaced. There might be fewer jobs to go around, or different types of jobs, but if there’s anything they can do about it, the industry born out of adapting to a crisis will try to adapt once more.

Oliver Kim is a development economist working as a Research Fellow on Coefficient Giving’s Global Growth Fund.8 He writes a Substack called Global Developments. Oliver Hanney is a contributing editor at In Development, and is the managing editor at VoxDev, where he hosts the Ideas in Development podcast.

If you have comments on this article, or wish to contribute to the discussion, please email them to letters@indevelopmentmag.com. Responses will be featured in a letters section.

  1. The OpenAI story was relatively unusual in featuring African workers; Kenya’s sector employed just 36,000 people in 2025. ↩︎
  2. It is likely that older tech workers have acquired both more “soft skills” and more specialized technical skills, making them more difficult to replace with AI. ↩︎
  3. The PLFS’s methodology was revised in 2025, making backwards comparisons tricky. Nonetheless, it’s the best data that we have. ↩︎
  4. Exact wording is uncertain, but he most likely did say something along these lines. ↩︎
  5. There is a growing body of research exploring new forms of measurement, e.g., machine-learning enabled nowcasting, satellite data, mobile phone data and automated classification. It remains to be seen whether new approaches like these can leapfrog the need for traditional administrative and survey data sources. ↩︎
  6. Paul Ehrlich, The Population Bomb (Sierra Club Ballantine Books), 80. ↩︎
  7. Originally known as the “Millennium Bug”; many computer programs stored years using just two digits, leading to widespread fears that systems would mistake “00” for 1900 and crash en masse on January 1, 2000. ↩︎
  8. Another team within Coefficient Giving, the Effective Giving & Careers team, is a funder of In Development. They played no part in our editorial decision to commission, edit and publish this piece, and Oliver is writing in his personal capacity. ↩︎

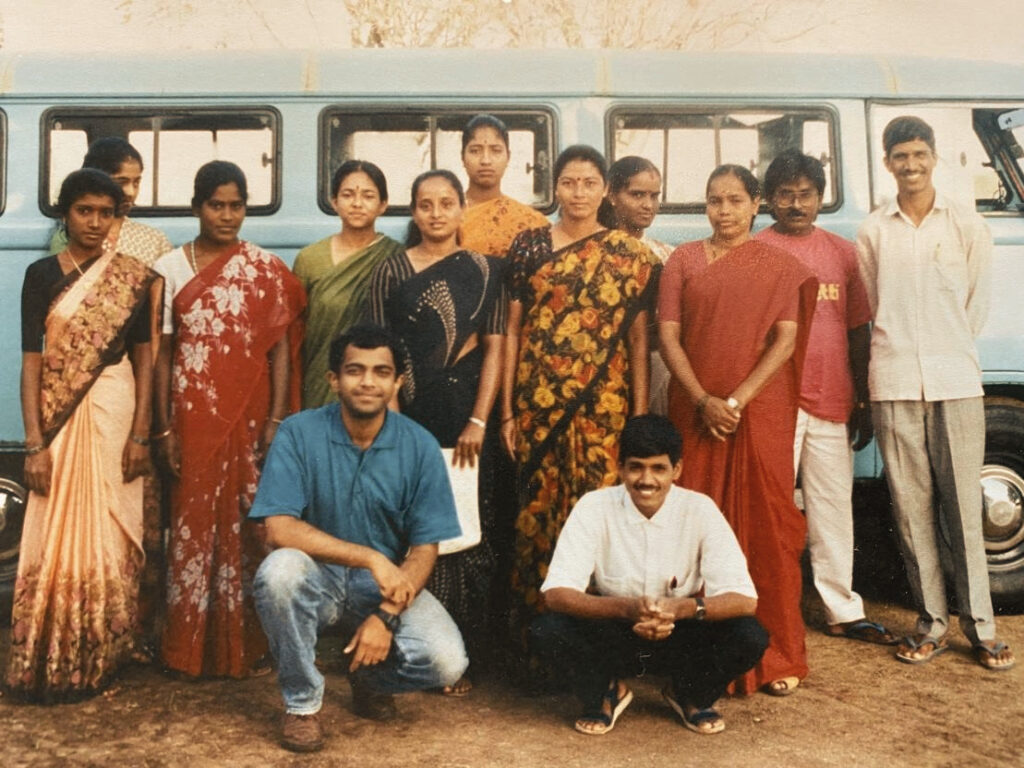
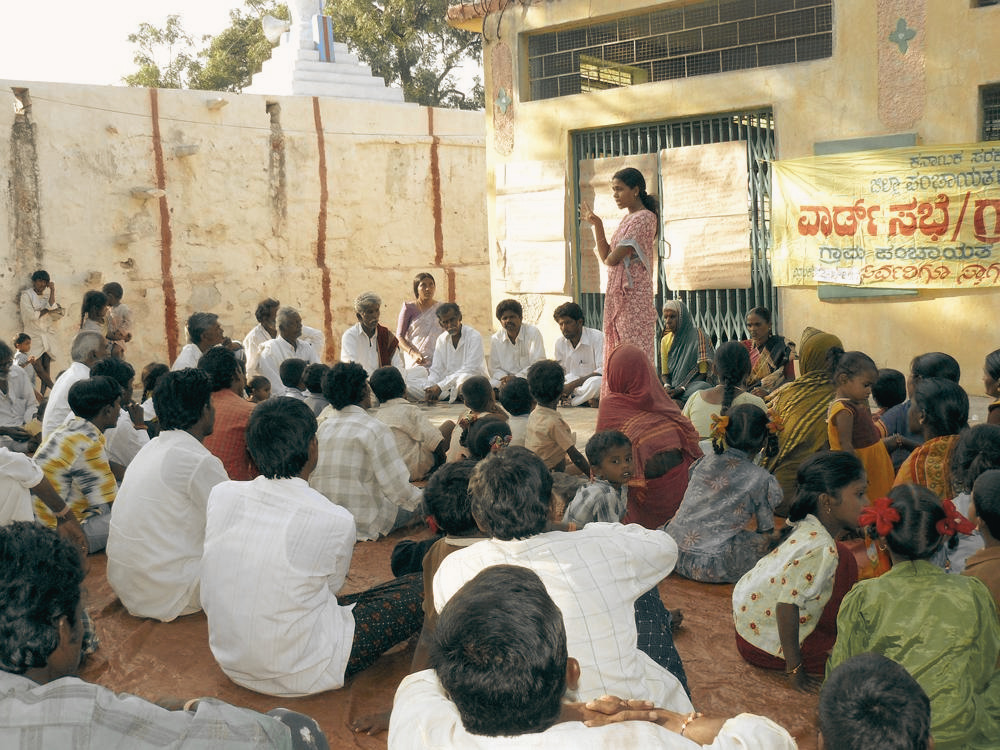
In 1993, I was sitting on a mud floor with a small group of women in a village in Karnataka, trying to start a conversation about their lives.

I had a survey for them to answer: heavy on questions that required numerical answers about consumption and family structure — who lived in the household, how old they were, what they had eaten, what the roof was made of. This is standard stuff in development economics.

We were a few minutes in when the door slammed open. One woman’s husband stormed into the room, grabbed her by the hair and dragged her out, shouting that lunch wasn’t cooked and she was wasting her time with us.

I was a young economist then, with a freshly minted PhD. My questionnaire had no item for what I had just seen. We had not come to study domestic violence; we had come to collect evidence on more prosaic questions of how sociocultural and economic systems shape marriage markets and living standards.

This is a vague enough remit that, in principle, almost anything should have qualified as relevant; it should have been easy to retool and collect more data that accurately reflected women’s lives. But the survey we had brought with us — with all its inherent assumptions — was calibrated to register what could be measured cleanly and not much else. Our disciplinary training was not fit for purpose.

It took us a week of staying in that village, drinking buttermilk and coffee, sitting through many silences, before one of the women finally opened up and said: “You have become our friends and we can’t lie to you anymore. We feel like we are in jail. Our husbands beat us all the time. They spend the family money on alcohol. No one helps.” 

That was new information. We rewrote our questionnaire on the spot, added items on wife-beating, which resulted in a mixed-methods analysis of domestic violence and one of the first economics papers on the subject in a developing country.

Photo of Rao with villagers
Vijayendra Rao (in blue shirt) with team in rural Karnataka, 1993. © Vijayendra Rao

I have thought about that week for more than 30 years. Not because the story is unusual — anyone who has done serious fieldwork has a version of it — but because of what it taught me about my own discipline. I am an economist, and economics is well known for its rigor, its emphasis on quantitative methods — and its distance from its subjects. Economics tends to focus on the measurable, which can exclude what is important; if it cannot be included in a survey module, it is not worth studying. But life is about more than survey modules, and the wall between economist and subject is not a methodological convenience. It is the central problem with the discipline.

I have spent my career as a kind of spy — an economist smuggling anthropology’s methods across the wall. I have written the careful academic version of this argument. What follows is the version I would talk about over a drink.

How We Got Here

Things did not start this way. In the late 19th century, Charles Booth, a shipping magnate turned amateur sociologist, took it upon himself to find out how the poor of London actually lived. He spent 17 years on the job. His team gathered information on 4 million Londoners: school inspectors, factory owners, clergymen, policemen and many more. They did surveys, but they also did much more: they took notes, they did open-ended interviews, they made color-coded maps. Booth used both numbers and stories because his question — what does poverty look like in London? — demanded both. He and his team stitched all of it into 17 volumes of “Life and Labour of the People in London,” showing, block by block, who was wealthy and who was destitute and who was somewhere in between. This integration of both story and data shaped economic and social policy in Britain for a generation.

Over the 20th century, that integration came apart. Economics, in its push for scientific status, narrowed itself to the analysis of quantitative data. Cultural anthropology split off into the ethnographic tradition — some of it deeply insightful, and some of it consumed by critique and navel-gazing. Sociology fragmented into many parts and a spiral of internal arguments over methods. Psychology went experimental. Political science was increasingly influenced by economics both in theory and method but retained an openness towards mixing qualitative and quantitative methods. By the 1980s, the disciplines distinguished themselves from one another mainly by what they refused to look at.

In economics, there were a few attempts to bridge this gap that did not have much of an impact. Back in 1984, Pranab Bardhan organized a seminal conference on “Conversations Between Economists and Anthropologists” on data and mixed methods. In 2002, I tried to make a case for “participatory econometrics.”

Then came the credibility revolution. In an effort to make research more credible and reliable, causal inference became the lodestar of empirical economics.  This meant that economists could say with confidence that A caused B, but it also meant neglecting the types of questions that could not be answered with these tools.

I do not want to be misread. The credibility revolution is a major leap forward for the social sciences. We can now answer questions that were genuinely beyond us 30 years ago. But when the only acceptable tool is a hammer, one tends to look for questions that could use a nail. Economists tend to prefer questions that can be answered cleanly and leave aside those that cannot. In development, the consequences have been particularly stark. We can now estimate to three decimal places how a cash transfer affects a child’s height. We have almost nothing to say about how the program worked (or did not work) and we almost never hear directly from the child and their family about what they had to say about it — in their own words.

The Distance Problem

In 2002, the sociologist Michael Burawoy drew a hard line between what he called positive science and reflexive science. Positive science — which is roughly economics — insulates itself from its subjects. Data collection is standardized so it does not matter who is collecting the data. The researcher does not have to be on site; a survey firm can administer a survey as well as s/he can. The world is to be observed, not participated in. Reflexive science — ethnography, in its best form — embraces the opposite point of view. The interview is not separate from the intervention; it is part of it. The researcher is not separate from the research; rather, her presence is a key part of the process.

Burawoy thought these two ways of doing social science were so different that they could never be reconciled. I disagree, and I have spent much of my career trying to marry the twain that he argues could never meet. But he is right about one thing. The distance between researcher and researched is real, and in development economics it is stark.    

Almost everyone I know who studies poverty has never been poor. We are often from different countries, different social classes, different castes and races, often speaking different languages, from the people we write about. None of that disqualifies you from working on poverty — it would be a strange profession that insisted only the poor could study poverty — but it should give us some humility. Most development economists do not know what the lives of poor people are actually like, day in and day out.

What the discipline rewards instead is a performance of objectivity: Researchers should not influence their subjects; they should stay at arm’s length and use the same tools as everyone else. Your subjective suspicions should not contaminate your analysis. You are not a part of the subject group, and you should not be; your influence upon them would make your research less valid. 

In short: the more distance we have from those we study, the more clearly we will see them. The opposite is closer to the truth. Distance does not produce clarity; it produces the kind of clarity you get from squinting through a small circle that you have cleaned inside a dirty window. It convinces you that what you can make out from where you are standing is all there is to see.

Four Things We Could Actually Do

So what would it take? I suggest four things economics (development or otherwise) could do to limit researchers’ distance from their subjects. 

Cognitive Empathy

The sociologist Mario Small uses the phrase “cognitive empathy” to mean the ability to understand a person’s predicament as they understand it. It does not suffice to think about how you would feel if you were in their position;  you must think about it as they understand it from theirs. It is much harder than it sounds. It requires you to take seriously the possibility that your subjects’ theory of their own lives is more accurate than yours.

Some of the best development economists I know have this in spades. Jean Drèze has lived for decades in the rural India he writes about, refused funding from institutions like the World Bank that he thought would compromise his independence and successfully pushed for one of the largest rural employment guarantees in the world. Despite this, he almost never publishes qualitative analysis; his work is overwhelmingly quantitative. But every sentence is shaped by years of having actually listened. He is not alone among economists; Christopher Bliss and Nicholas Stern spent eight months in the village of Palanpur in the mid-1970s and inspired what is now a multigenerational research project.

The point is not that empathy must show up as a qualitative paragraph in the paper. Merely having done a focus group that you report in a footnote for color (and to signal your field creds) is not enough. Many economists already do this; it clearly isn’t sufficient to reduce the distance between the researcher and the researched.

It is that the work has to be shaped by it. And here is the awkward truth: Almost all of contemporary development economics is not. We design experiments based on the input of other economists. We read papers, we deliberate in seminars, we come up with new models based on economic theory rather than experience. The intervention happens through an implementing partner, and the endline survey through a survey firm. Even the analysis might be handled by a research assistant (or, now, coding agent). The result is a body of work that is technically immaculate and substantively thin. To paraphrase an old chestnut: It is an expensive way to be precisely trivial rather than vaguely right.

Narratives Are Data

People do not talk in numbers. They talk in words. They tell stories, they contradict themselves, change the subject and circle back. They forget things and remember them halfway through the next topic; they get distracted and tell you about something interesting but unrelated. Survey instruments are a kind of violence against this — useful violence, often, but violence nonetheless. Instead of the messiness of human life, you get a small number of tick boxes.  If the boxes are well designed, you get a lot of information. But you never get everything, and frequently, you will miss the most important parts.

The book “Portfolios of the Poor” is what every economist should be made to read on this point. The authors — a development economist (Jonathan Morduch), an anthropologist, a microfinance practitioner and a finance expert — gave up on standard surveys and instead visited 250 households in Bangladesh, South Africa and India at least twice a month for a year, building “financial diaries” out of long, open-ended conversations. They estimated that one-shot surveys were missing about half the financial activity of a poor household. Half. The poor were not, it turned out, simply consumption smoothing. They were trying to manage portfolios of assets under conditions of grotesque uncertainty, with very little room for error. No standard consumption survey would have shown the level of complexity in how the poor managed their households; researchers had to let households describe their finances in their own words.

I have done versions of this myself. With Paromita Sanyal, I spent 10 years analyzing transcripts of 300 village meetings in South India — what we called “oral democracy” — to understand whether poor, low-literacy, deeply unequal communities could actually deliberate in any meaningful sense. (Spoiler: They can, and the quality of that deliberation depends much more on state government policy than on the village’s literacy rate.) 

Ten years is a long time. It is also why so few economists do this kind of work. Tenure evaluation is often slower than that; investing in something that might not bear fruit until after tenure is a difficult choice for many early-career faculty. Worse yet, this kind of data does not always lead to the kind of publication that gets you tenure. My work was eventually published as a book, not a top-five journal article — a much lower-value thing when one is up for tenure. 

And until very recently, the technology to scale up the analysis of narrative data simply did not exist. The 10 years were a function of the technology of the time, not a requirement of the method. With today’s technology — recording devices, AI for transcription — collecting qualitative data is easier than ever. Embedding a few weeks of open-ended interviews in a standard RCT, reading the transcripts your survey firm’s enumerators could be collecting anyway, piggybacking on existing qualitative data — these fit inside a dissertation timeline, and the tools for scaling them are getting cheaper every year. 

The deeper point is the disciplinary reflex. Open-ended narrative is still routinely treated in economics as “anecdote” rather than data. Researchers who mix quantitative and qualitative methods are, to quote the political scientist Atul Kohli’s wonderfully insightful joke, “stuck between a rock and a soft place.” Reviewers reject them because of a perceived lack of rigor, and editors do not see the added value. 

I have had this happen to me directly. The two early papers on domestic violence I mentioned earlier — one using a combination of ethnographic and econometric methods, the other building a game-theoretic model of dowry violence and testing it with survey data — were originally a single paper. When I included qualitative methods in the paper, it was rejected from several economics journals. My co-author Francis Bloch and I gave up and split it in two — one of the resulting papers was accepted into one of the most prestigious journals in economics.

This distaste for the qualitative is one of the stranger superstitions in the discipline; there is no methodological reason a transcript is less informative than a Likert scale.

Take Process Seriously

Empirical economics, especially since the credibility revolution, has become almost monomaniacally focused on outcomes. Did the intervention work? By how much? For whom? These are good questions, but they are not the only ones. It is rare for empirical economics papers to spend much time focusing on how an outcome happened. Who said what to whom to start the process of change? Who were the early adopters, and who had to be brought along later? What did people think about the intervention? An RCT can tell you if an intervention worked; ethnography can tell you why. Mechanisms often get short shrift in empirical economics. You do your RCT, you get your result, you come up with some plausible explanations, you write up a model for how those explanations would work (if they’re right). This is fine as far as it goes, but it does not go very far.

The map of mechanisms you can construct from theory alone is a small subset of the mechanisms that actually operate in the world, and reasoning from outcomes back to mechanisms is a notoriously unreliable exercise. The alternative is to actually go, talk to people and observe.

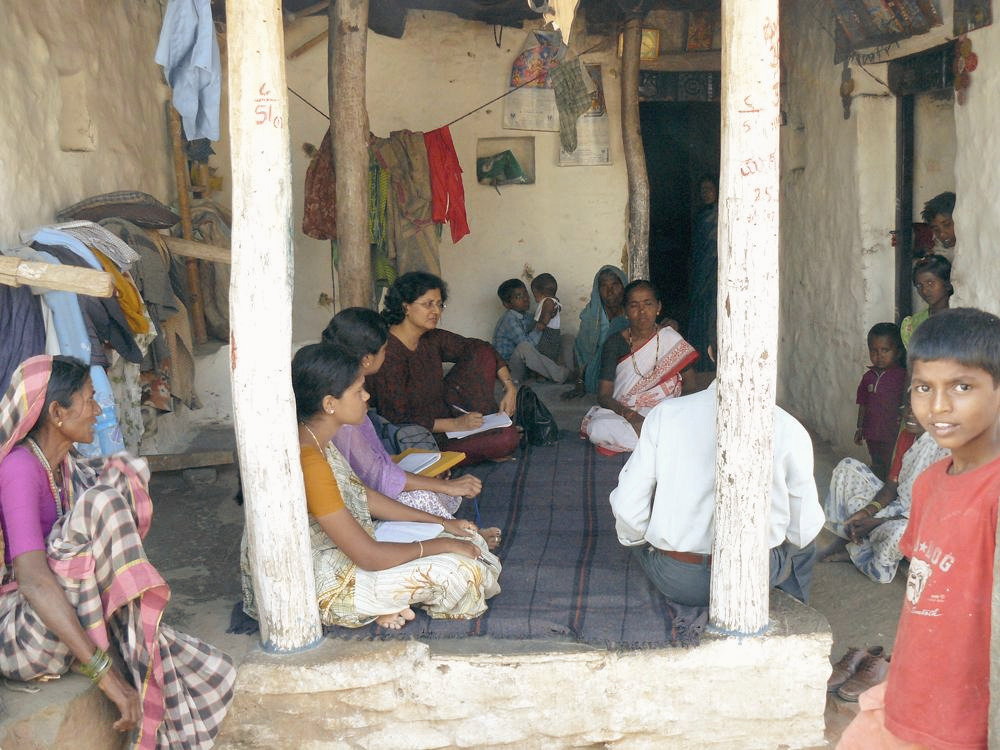
A few years ago, colleagues and I worked on a randomized trial in rural Karnataka to test whether intensive training in participatory planning would improve village governance. The intervention assigned 50 villages to the participatory training, planning and monitoring exercise and 50 to control. Instead of just relying on a baseline and endline survey (which we also did), we did the unusual thing of embedding five trained ethnographers in matched treatment-control pairs of villages for the duration of the study. They produced 240 monthly reports over four years.

villagers discussing the study questions
Participatory planning in Raichur District, Karnataka © Vijayendra Rao

The headline result was a null. The intervention did not produce statistically significant gains over the comparison villages. In the standard economics genre, that would have been the end of the story — a disappointing null. Perhaps the paper would include a theoretical model on why participation fails, but there would be very little to learn here.

But because we had the ethnographies, we could see what actually happened: The “failure” was not a failure of the idea but of the conditions under which it was tested. The quality of implementation varied a lot: Some facilitators were excellent and some were poor. Higher officials in the government did not take the intervention seriously and frequently transferred and replaced facilitators for reasons that had nothing to do with the intervention. Persistent caste-based inequality was actively chewing through any gains the training produced. The ethnography was the core of the paper, not just the color. 

Kripa Ananthpur conducting an interview about the intervention with villagers
Kripa Ananthpur conducting an interview about the intervention. © Vijayendra Rao

Respondents as Analysts

If our purpose as researchers is to help people become better off, then the people themselves should at minimum be told what we found. Development practitioners have been talking about including those they study in the process for decades — and yet, this is rarely implemented. And reporting findings would only be step one. It would be better if they helped design what we ask. Best of all, they should be able to conduct research on their own lives without our mediation at all.

In 2014, with a group of colleagues at the World Bank, I tried this. We worked with representatives of more than 200 tribal villages in South India to co-produce a method we called participatory tracking. The villagers spent weeks deciding for themselves what counted as the good life, turned those ideas into survey questions, tested the questions in their own villages and then — using tablets and a system of video-based training — surveyed their own neighbors. In a single district, we conducted a census of 32,000 households in about six weeks. 

Only 17% of the questions overlapped with the standard Indian National Sample Survey. The villagers were asking different things because they wanted to know different things. For instance, in order to assess whether a household was poor, they devised the following question, which proved extremely effective: “Did the last person to eat in the family ever go hungry in the past week?” To a respondent this was obviously a question directed at the mother, and mothers in food-constrained households often went hungry in order to feed the adult men and children in the family. 

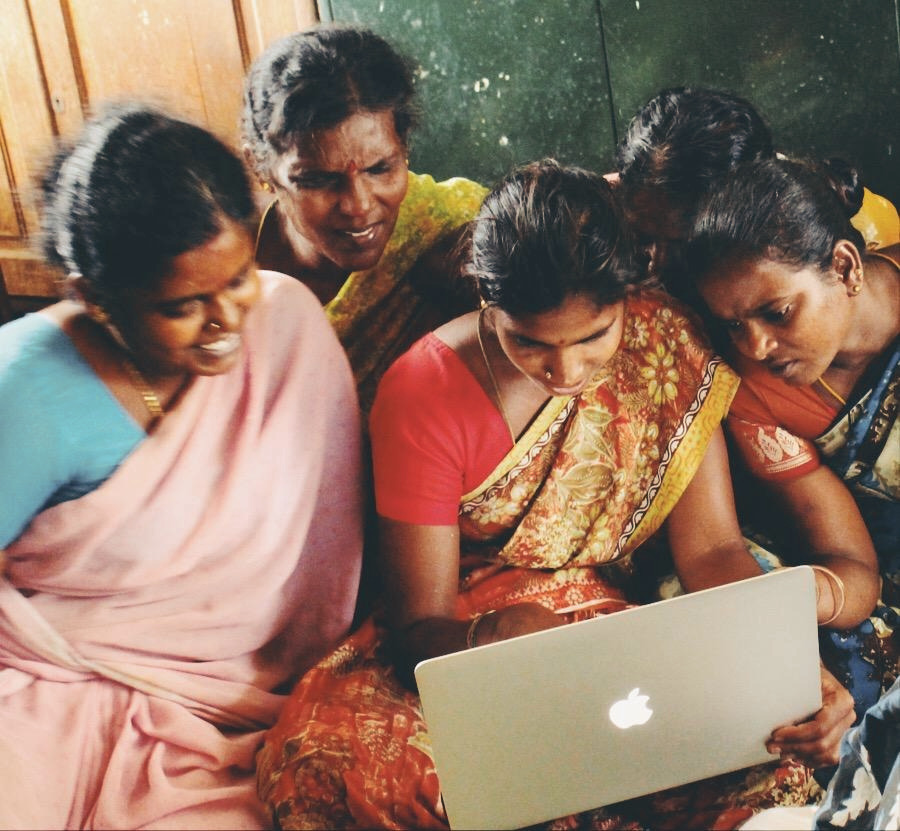
Literacy rates were low, so we collaborated with the villagers to produce data visualizations of the results. We iterated until people who could not read could see at a glance how their village was doing on what they cared about. The data then got used in actual village meetings. The quality of those meetings improved noticeably, because everyone was working from the same picture instead of arguing about the facts.

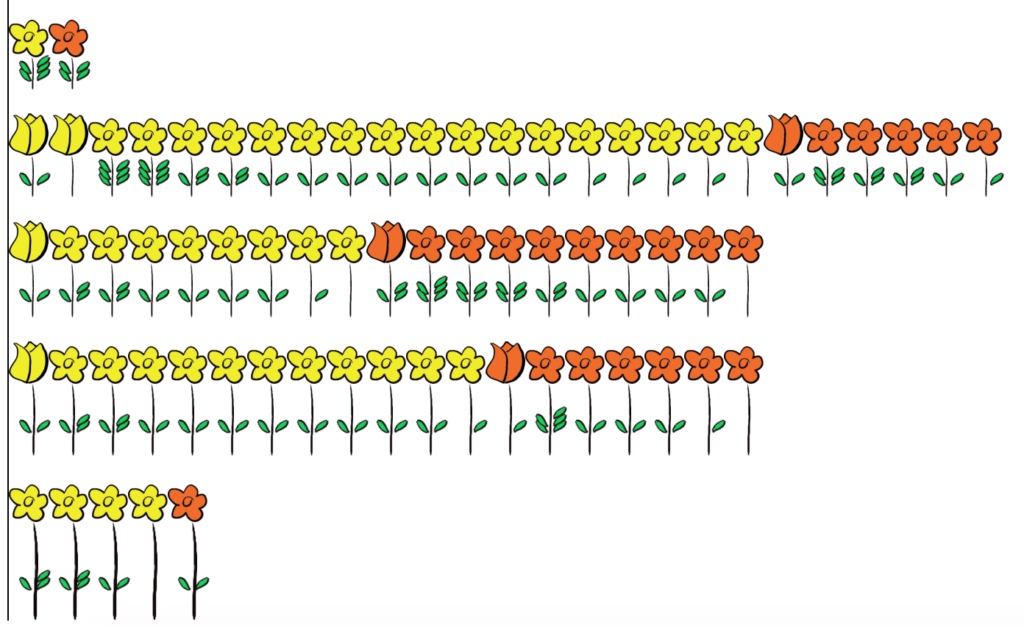
Instead of the usual LaTeX table, here is a visualization of marriage patterns that we co-produced.

Visualization of marriages in a village

Each woman in the village is represented as a flower. The height of the flower is the age at which the woman got married. The number of leaves is the number of children resulting from the marriage. A red flower indicated that the woman had married a blood relative, and a yellow one meant that she had not. A flower bud meant that the marriage was not consensual, and a bloomed flower was consensual. The mappings between the flower’s appearance and meaning were tweaked by the women to make them more relevant to their local contexts, and therefore more intuitive. 

Some villagers who saw this visualization immediately disregarded the high proportion of red flowers they saw, as marriage within families is accepted and widely practiced. However, other communities wanted to reduce the ratio of red flowers to yellow flowers by educating future generations of women about the problems related to intra-family marriage. 

Women in Rural Tamil Nadu discussing the visualizations © Vijayendra Rao

Trust me, I know how this sounds. The rest of the field would file this experiment under “charming but unscalable.” That is a little bit true; a participatory, co-produced survey process is slower and more laborious than a standard questionnaire. We could not use a standard set of questions, because the standard set of questions wasn’t what people actually wanted to know. And the alternative was the status quo: where we would show up, ask people a bunch of questions about their lives — that they really didn’t feel were all that relevant to them anyway — and write a paper that no one surveyed would ever read. Given that, co-produced surveys seem worth the time. 

The LLM Problem

The technology for coding open-ended interview questions has also gotten much better in the last decade. Large language models are particularly adept at going through large amounts of unstructured text and pulling out themes; Claude’s current abilities would have seemed like science fiction in 2014. Now, they can essentially replace a research assistant in coding English-language text. I have used LLMs too. Some of my recent work piggybacks on a panel of Rohingya refugees and Bangladeshi hosts where we conducted long open-ended interviews with 2,000 respondents and developed a method we call iQual. It analyzed a small subsample using interpretative sociological qualitative coding and then used machine learning to scale up the codes to the full sample. This kind of project was simply not feasible before.

But using LLMs outside of Western contexts isn’t always simple. We compared our “bespoke” method to LLM-based coding and found that LLMs gave us highly biased results — possibly because they are not trained on Bengali and Rohingya dialect text. The bias of a poorly designed survey is at least legible. The bias of a frontier language model trained on the internet is not. Hopefully this is a temporary problem; with efforts in place to improve AI with under-resourced languages, LLMs will get better at this with time.

So I should be excited, and on most days I am. But I want to be careful here. It’s true that there is a version of the future in which LLMs democratize narrative analysis in the same way that calculators did for arithmetic. They are faster and cheaper and they can vastly expand who can do qualitative analysis. Unfortunately, however, I fear it is more likely that they will be used to widen the distance between researcher and respondent. If a researcher never spends time with the people they study and simply reads the LLM’s summary, there is no cognitive empathy. The LLM is the only one listening — not the researcher. My rule of thumb is that LLMs cannot substitute for a human. They can extend your reach — help you process data more quickly — but they cannot replace you. You still need to spend time in the field; you still need to talk to people about their lives and their needs. You must read the transcripts yourself; you should know the people and the context well enough to be able to tell if the LLM’s coding has gone awry. LLMs might be powerful enough to do 90% of the job — but that remaining 10% should not be automated away. Empathy is not a Claude skill.

What It Would Actually Take To Listen to Respondents

Some of this can be accomplished by individual researchers deciding to do their work differently. Quite a lot more of it requires the discipline itself to change. Right now, the professional incentives still push young scholars towards “business as usual.”

Journal editors have to stop reflexively rejecting qualitative material. Graduate programs will have to expand beyond their teaching econometrics into teaching qualitative methods as well. Hiring committees will have to start to value time spent in the field. Funders have to accept that good mixed-methods work can be expensive and slow — certainly slower than running a regression from a Cambridge office. But it will also make economics a stronger discipline. Spending time with people will produce insights that can be obtained no other way.

In the short run, I am not optimistic. Disciplines are stubborn things, and economics is more stubborn than most. It is a discipline already struggling to diversify beyond a few top programs and economics seems to be particularly prone to reproducing class hierarchies. But I am less pessimistic than I might be, because it seems things are already beginning to change.

A generation of younger development economists is more comfortable doing fieldwork than mine was. Adjacent disciplines — political science, sociology, public health — have been mixing qualitative and quantitative methods for a long time without losing their disciplinary identity.  Some of these disciplines even co-author with economists, adding depth to the rigor of an economics paper. And some funders are also starting, slowly, to ask harder questions about whose voices are represented in the work they pay for.

My argument is, fundamentally, not that complicated. If you study people, you should listen to them. This is doubly true if you study people who live lives that are very different than your own. It is on you, as the researcher, to try to close the distance between you and your subjects — building bridges instead of walls.

Thirty years ago, Robert Chambers asked an important question: “Whose reality counts?” It has still not been answered. Economics has preferred to duck the question, pretending that empirics could substitute for an answer. I do not think it should continue to do so. Indeed, I think this remains one of the most important open questions in development research.

The woman in Karnataka dragged out of our focus group by her hair was telling us something — that her reality was not captured by our questions. It took us a week to be able to hear it, and the only reason we eventually did was because we were still in the village a week later. There is no shortcut for this. 

Numbers help. So do words. But most important is sitting in the village and listening long enough, and with enough cognitive empathy, that someone tells you the truth.

Vijayendra Rao is a development economist and social scientist who combines econometric methods with ethnography. He spent 27 years as a Lead Economist in the Development Economics Research Group at the World Bank, and is currently the Roberta Buffett Distinguished Scholar-Practitioner in Residence at Northwestern University. His interests include gender, culture, participation, deliberative democracy, political economy, and innovations in mixed methods. His recent methodological work with Julian Ashwin, Monica Biradavolu, Aditya Chhabra and others uses natural language processing to analyze open-ended interviews at scale and compares it to LLM based qualitative analysis. His latest book, Revolution by Stealth: How Women’s Groups Catalyzed a Cultural Transformation in Bihar (with Shruti Majumdar and Paromita Sanyal), is forthcoming from Cambridge University Press in September 2026.

cartoon of woman with glasses with an ear instead of a lense

If you have comments on this article, or wish to contribute to the discussion, please email them to letters@indevelopmentmag.com. Responses will be featured in a letters section.

Even as global progress against poverty seems to slow, India has remained a bright spot. In the last several decades, the now most populous country’s transformation has been nothing short of extraordinary, with per capita incomes increasing by over a factor of six in a quarter century.

The share of the country’s population living in extreme poverty has been slashed, as has the rate of child mortality, which fell by nearly 80% from 1993 to 2021.

So why are its children so short? Even as India’s per capita income has outpaced the per capita incomes of many of its counterparts in Sub-Saharan Africa, India’s children remain some of the shortest in the world—much shorter than their peers in Sub-Saharan Africa. India is a rising giant, but its children are anything but.

Chart of height-for-age z-score vs. ln(GDP/capita) in Africa and India
Indian children are shorter than African children at comparable income levels.

To readers in rich countries, this fact may not immediately come across as cause for concern. Height is a product of genetics, so short Indian children may simply reflect differences in potential heights across ethnic groups. Indians may simply be a short people—genetically prone to being shorter than Africans or Europeans.

Thinking of height as predominantly a product of genetic inheritance, however, is a luxury of having a high income. In the United States—and other rich countries—children rarely eat too little or become too sick to grow to their full potential height. There, height largely is a product of genetics. This is not the case in many poor countries, where malnutrition and childhood disease abound. Many people in poor countries are short in adulthood not because of short parents, but because they do not eat enough or are too sick in childhood to grow. Calories in, centimeters out.

Childhood stunting can have lasting implications. Economists have long shown that taller people earn more. This result is likely not because employers simply prefer tall people; rather, nutrition also matters for cognitive development. Malnourishment starves the growing brain of much-needed energy, and stunting may be a physical sign that children are not achieving their maximum cognitive potential. Furthermore, if malnourished children are stunted both physically and cognitively, effects may persist long beyond childhood. Full nutrition in adulthood may be insufficient to make up for deficits early in life.

Governments therefore care a great deal about how short their citizens are. They also want to know why children aren’t getting what they need to grow. It behooves a government to know if it is childhood illnesses, sanitation or another factor at play. Without this information, they risk not only a physically but cognitively stunted generation. Though heights no longer remain our only measures of population well-being, they are a useful and transparent yardstick. For that reason, measuring them has become a central part of many household survey programs, including India’s National Family Health Survey (NFHS).

Heights are also relatively easy to measure. It is much easier to pull out a measuring tape than collect a blood sample. We can even look at historical data to see the rise and fall of civilizations.

One of the most transparent ways to see the declining fortunes of Native Americans in the American Great Plains is through falling heights. Native Americans were once some of the tallest peoples in the world, a status they abruptly lost with the slaughter of the bison at the end of the 19th century.

So: Rich countries should have tall kids. And as countries get richer, their kids should get taller. But in this simple taxonomy, India is a dramatic outlier. Heights have grown alongside the country’s per capita income, but at a remarkably slow rate—much slower than in other countries.

Is it just genetics? It can be difficult to tell, because you have to disentangle a person from the place where they live. Telling whether a child in Bihar is short because they live in India or are Indian is an impossible task that even the best econometric tools cannot hope to resolve. To find answers, researchers therefore study people for whom person and place are decoupled: immigrants. 

Economists Caterina Alacevich and Alessandro Tarozzi do just that, studying Indian families who migrate to the United Kingdom. When they arrive, Indian immigrants are shorter than native Brits. However, remarkably, their young children are as tall as their British peers, catching up in a matter of one generation.

This finding is striking. It does not seem to be simply that Indians are just shorter than Africans (or Brits). Something causes Indian children to stand shorter than the children of other nations. And whatever that something is does not fit in the overhead compartment when flying from Delhi to London.

If it’s not genetics, then what explains the Indian height enigma? One answer may be (eldest) son preference. Thirty-five years ago, Nobel Prize-winning economist Amartya Sen drew the world’s attention to an unsettling fact: The world had fewer girls than it should, with many Asian and African countries having a larger male than female population. The number of “missing women,” and the reasons they are missing, are controversial, but researchers often point to causes like sex-selective abortion or female infanticide.

Even when girls are born, though, they may receive fewer resources. In India, eldest sons in Hindu families often play important social roles, living with aging parents and inheriting property. Eldest girls—or indeed, girls in general—play no such role. This may encourage poor families—with only limited resources—to prioritize eldest sons over other children. In a paper in the Quarterly Journal of Economics, for example, economists Seema Jayachandran and Ilyana Kuziemko show that women stop breastfeeding daughters earlier if they do not have older brothers. Because breastfeeding suppresses ovulation and delays the return of fertility, mothers without sons may wean their daughters earlier in the hopes of conceiving a boy. 

Perhaps it is simply that eldest children, regardless of gender, get the resources. In the American Economic Review, Jayachandran and Rohini Pande argue this is the case in the aptly named paper “Why are Indian Children So Short?”  showing that though on average Indian children are shorter than African ones, this is not true for all types of children. Firstborns in India are as tall as their counterparts in Sub-Saharan Africa, but a gaping divide emerges for non-eldest children. Thirdborns and later in India are a third of a standard deviation shorter than their counterparts in Sub-Saharan Africa, compared to no gap for firstborns. Eldest sons are prioritized, and eldest daughters—by nature of their age—are less likely to have an older brother to compete with for resources during the nutritionally vital early years of life. This favoritism may come at the expense of later-born children.

Chart of height-for-age z-score vs. birth order in both Africa and India
Birth order affects height much more in India than in Africa.

Jayachandran and Pande’s paper has been very influential in academic economics, becoming a somewhat definitive source on the role of son preference in Indian society. However, their claims have not gone unchallenged. Diane Coffey, a sociologist, and Dean Spears, an economist and demographer, both of the University of Texas at Austin, have questioned the birth order hypothesis.

What could explain the fact that firstborn sons are taller than second or thirdborns? One answer is Jayachandran and Pande’s—eldest son preference. Another is that firstborns come from different kinds of families than second or thirdborns. The sample of firstborns across a whole population includes many kids from families with one child. Secondborns, by contrast, come from families with at least two children, and thirdborns necessarily come from families with at least three kids. In a recent paper, Spears and Coffey alongside economist Jere Behrman show that this effect is important in India, where larger families are also generally poorer. In other words, firstborns without siblings are more likely to come from richer families, where it is less likely that children won’t have enough to eat. Jayachandran and Pande are aware of this fact, and adjust for maternal characteristics to try and account for it. However, Spears, Coffey, and Behrman argue that conditioning on family size directly largely eliminates the link between birth order and children’s height.

If eldest son preference is not a silver bullet, then what can explain why Indian children are so short? The best alternative answer we have may lie with where people in India use the bathroom.

Alongside nutritional inputs, children’s heights are a product of their disease environment in childhood. Parasitic worm infections can sap nutrients from growing children, and diarrhea caused by exposure to fecal pathogens can induce violent and dangerous losses of fluids and nutrients. Avoiding these outcomes largely comes down to improving sanitation, which remains poor in many developing countries.

Despite its rapid economic progress, India remains an outlier in sanitation coverage as well. In 2019-21, large shares of India’s population primarily defecated in the open—that is, not in a toilet or latrine, but simply … on the ground. In a densely populated country, this is a recipe for public health concern. Fecal bacteria wreak havoc on children’s digestive tracts, in many cases causing chronic gut infections that limit nutrient absorption. These concerns have prompted global campaigns to eliminate open defecation, from a Gates-funded moonshot to invent a “next generation toilet” to an aptly named theme song and social media campaign from UNICEF India.

Whether, why and to what extent open defecation persists in India are controversial questions, with at times surprisingly vicious politics behind them. In 2019, Prime Minister Narendra Modi declared India “open defecation free”—thanks largely to the Swachh Bharat Mission, an initiative aimed at eliminating the practice in part through the construction of over 100 million latrines.

Many have called this claim into question, in part because of clear evidence to the contrary in the National Family Health Survey (NFHS), a national household survey program, one round of which began that year. Between 2015-16 and 2019-21, the share of households reporting that they practice open defecation fell from 55 to 27%—an impressive drop, but far from elimination.

Importantly, the way NFHS asks about open defecation may also overstate progress. Asking whether each member of a household defecates in the open yields higher rates than asking whether a household collectively does. Even in households where some members use a latrine, other household members may continue to defecate in the open. This would mean that as a percentage of population, far more than 27% could defecate in the open.

Coffey and Spears’s research suggests that this may be more likely than son preference to explain the disappointingly low stature of India’s children.

There is some evidence to suggest it could be. Randomized experiments comprising interventions aimed at improving sanitation coverage have pointed to at times positive effects on children’s heights. Descriptive evidence also suggests that differences in sanitation coverage are more than sufficient to explain the Indian height enigma: If reweighted to take into account India’s density of open defecation per square kilometer, African heights would look remarkably similar to Indian heights.

Though strategies like community-led total sanitation—wherein latrine construction is paired with behavioral change interventions, often aimed to invoke “shame” among those who defecate in the open—can yield meaningful improvements in sanitation, they are far from a silver bullet. Evaluating whether, in an open defecation-free environment, India’s children would grow as tall as their counterparts in Africa is a difficult if not impossible counterfactual to construct.

It is possible that both stories are at least some of the explanation. Indian girls could receive fewer resources than their brothers and Indians might suffer from the likelihood of open defecation. Those aren’t even the only two hypotheses in the literature. Alongside poor sanitation and cultural norms emphasizing the importance of eldest sons, Indian diets are often high in carbohydrates and low on proteins and micronutrients, failing to meet dietary diversity standards. At least descriptively, these patterns can explain some of the disparities in stunting rates across districts of India. But isolating this effect causally is challenging. Diets are difficult to randomly assign, meaning researchers are forced to rely on “natural experiments.” One paper, leveraging exposure to India’s “Green Revolution” as a source of variation, finds that improved yields of wheat and rice reduced heights, perhaps as a result of reductions in protein intake and dietary diversity.

Litigating these debates is a challenge and a parable for just how difficult finding answers to even the most simple and consequential of questions can be. The Indian height enigma is also an allegory for the power of data at a time when the infrastructure essential to measuring progress—both in India and globally—is teetering on the edge. 

Prior to the 1980s, the world was remarkably devoid of data on the lives of the world’s poorest people; working out who was most deprived or what people died of was much harder and depended on less systematic information. At that time, we would not even know that Indian children were short, let alone have the ability to determine why. Household survey programs lent researchers new scope to examine the world and uncover paradoxes and facts with remarkably broad implications. A data-rich future is far from assured, however. In India, data collection has also taken a remarkably political turn, with a long-delayed census sparking controversy.

The most recent round of the NFHS—which was released just two months before this piece went to print—provides some promising signs that rates of stunting among India’s children have continued to fall. However, the convenient removal of data points related to sanitation, childhood sex ratios, and anemia—at least in early reports from the survey—will make the causes of this progress much harder to parse. The Indian enigma will likely continue to baffle, especially if the data used to interrogate it is allowed to slip away.

Wilson King is a PhD student in development economics at the University of California, Berkeley. His research focuses on health in low and middle-income countries.

cartoon of a man pretending to be as tall as a cardboard cutout

If you have comments on this article, or wish to contribute to the discussion, please email them to letters@indevelopmentmag.com. Responses will be featured in a letters section.

India produces enough buprenorphine, a medication used to treat opioid addiction, to serve about 450,000 patients each year. It is treating only 45,000. How do we fix this?

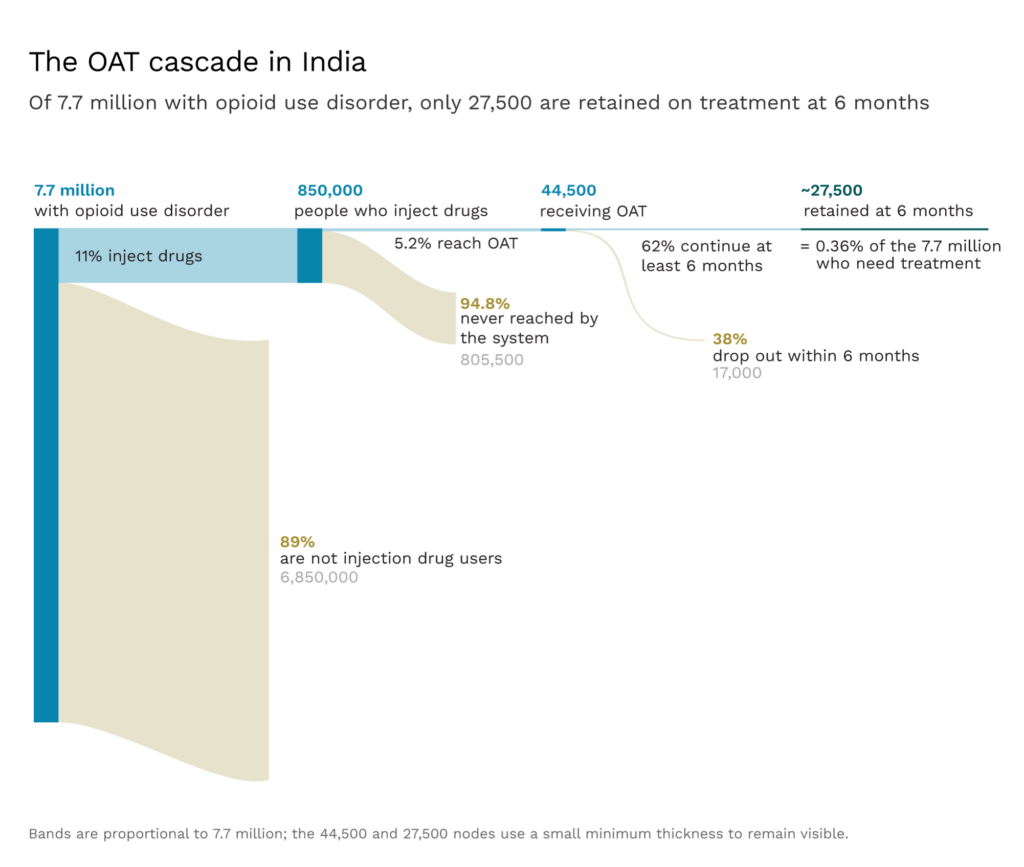
India has more people who misuse opioids than any other country in the world.1 But, of the 7.7 million people in the country who meet the criteria for opioid use disorders, fewer than 2% receive any evidence-based treatment.

Opioid addiction can sneak up on people. Many who use opioids don’t realize they’re dependent until they try to quit and then experience withdrawal. In Mizoram, one of India’s most afflicted states, the literal translation in Mizo for opioid-induced withdrawal symptoms is “suffer”. For users of opioids, “suffer” is as much a description as it is a metaphor. Coming off opioids involves severe cramps that seize the abdomen, sweating that won’t stop, tremors that look like convulsions, diarrhea and vomiting, chills, and many sleepless nights. Some of these symptoms can last for weeks.

Perhaps unsurprisingly, without sustained treatment, the rates of relapse among people who use opioids run between 80% and 90%. They then put off trying to quit again, because they simply don’t want to risk feeling that degree of pain a second time. But, after a relapse, the risk of fatal overdose is particularly high. While a user’s cravings may be just as intense, their body’s tolerance has decreased. Annual mortality among people who use opioids non-medically typically ranges from 1% to 3%.

Fortunately, for the last three-and-a-half decades, there has been access to successful treatment options. Opioid agonist therapy (OAT) recommends replacing illicit opioids with prescribed doses of methadone or buprenorphine. These opioid substitutes (agonists) bind to the same receptors in the brain, so they ease the cravings that users feel without producing the same “high”. This allows users to transition away from the dangerous parts of drug use without having to suffer withdrawal. This treatment works; these medications roughly double the likelihood of staying in treatment and cut the risk of dying from a drug overdose by about 70%.

Scaling OAT, then, seems like an obvious win. The therapy is relatively easy to administer—it can be done in an outpatient setting—and is very cheap. In India, the medication itself can cost as little as 25 to 30 US cents a day. The cost is clearly worth it; treatment pays for itself several times over because every dollar invested yields “a return of between $4 and $7 in reduced drug-related crime, criminal justice costs, and theft. When savings related to healthcare are included, total savings can exceed the costs [of OAT] by a ratio of 12 to 1.”2

And yet, OAT remains woefully underused in India. Just 2% of those who could benefit from it end up getting access, while the remaining 98% are left to fend for themselves. Other low- and middle-income countries manage to treat a considerably higher percentage of those who use opioids. If India scaled OAT to even 25% coverage—still below that of countries like Malaysia, Vietnam, and Iran—it could avert 5,000 to 7,000 deaths per year.3

Sources: Dhawan et. al (2017), EUDA European Drug Report 2025, Pirnia (2024), Luong (2024)

Why is India failing on this issue?

It is not because policymakers think OAT doesn’t work. Instead, it is because three decades of policymaking have made it extraordinarily difficult to prescribe the medication, dispense it, or stay on it. India simply doesn’t trust its doctors or patients enough to implement international best practice.

Tracing the Boundaries of Opioid Use in India

Opioid use is not rare in India. About 2.1% of the Indian population uses opioids, roughly three times the world average. In any given year, about a third of those—or 7.7 million people—will engage in harmful opioid use. As a percentage of the population, opioid misuse is more common in India than in South Africa or Germany. And each year, at least 77,000 people will die from drug-related causes. This, too, is not a small number; it is similar to the number of Indians who die from breast cancer.

Injection drug users are the minority of Indian opioid users, making up only about 11% of those who misuse opioids.4 Most injection drug use in India is heroin, trafficked across borders from Myanmar. This means the epidemic is geographically concentrated in India’s northeastern states. Mizoram, Manipur, and Nagaland sit along trafficking routes from Myanmar, leaving them particularly exposed. Heroin also crosses from Afghanistan into Pakistan, and then into the street markets of India’s Punjab state.

The states of Mizoram, Nagaland, Arunachal Pradesh, Sikkim, and Manipur all have opioid use prevalence above 10% of the adult population. Between 4% and 7% of the population meet the criteria for problematic use; this is some 10 times the national average.

Source: Ambekar A et al. on behalf of the group of investigators for the National Survey on Extent and Pattern of Substance Use in India (2019).

And in these places, the consequences of use extend well beyond addiction. HIV prevalence among people who inject drugs reaches 32% in Mizoram and 18% in Tripura. Hepatitis C prevalence exceeds 60% at multiple sites in these states. Getting the rules of treatment right here could reach a disproportionately large share of the national burden of infectious diseases. 

The majority of users, though, smoke or take pills. Recently, India has seen the same expansion of pharmaceutical abuse that has been seen elsewhere in the world. India makes more generic drugs than any other country, and this includes opioid painkillers like tramadol and tapentadol, which are cheap and easy to get. Pharmacies routinely sell such drugs without a prescription. Indeed, the concept of prescription-only drugs is often more of a suggestion than a rule in many Indian pharmacies. This makes access easy and abuse more likely. About half of India’s opioid users now abuse via prescription drugs, rather than via heroin.

Getting Harm Reduction Right

To many, opioid agonist therapy does not seem like treatment at all. It sounds like simply providing drug addicts with their fix. Perhaps it is a less harmful way to take opioids, but they are still taking opioids. Is it really the role of the state to provide addicts with a different type of drug?

But to even ask the question is to misunderstand the treatment. Users on OAT do not get high, and they avoid the harmful parts of drug use. A major meta-analysis found that OAT reduces all-cause mortality by about a third to a half. It also reduces illicit opioid use, criminal activity, and the needle-sharing that spreads HIV. This is why OAT is the gold standard of treatment worldwide.

Over months and years, OAT allows people to lead stable lives in which they hold down jobs, save money, and rebuild relationships with their families. OAT treats opioid use disorder like any other chronic condition: the goal is not to get off the meds, but to have a functional, healthy life.

In rich countries, coverage is high. France treats more than 80% of its high-risk opioid users. Across the EU as a whole, roughly 60% of high-risk opioid users received OAT in 2023.

But it is not just rich countries that use OAT; it is also widely used in middle-income countries. For example, Iran began its national OAT rollout in the mid-2000s—about the same time India began scaling its program—and now delivers OAT treatment to 31% of those who would benefit from it. Vietnam’s treatment program reaches 25% of opioid users.5 India’s coverage rate is dismal by comparison: less than 2% of people in India who need it receive OAT.

How India Built The Wrong System

To understand why so many patients remain untreated, it helps to understand the history of OAT in India. Opioid agonist therapy was first introduced in India to counter the rise in HIV infections in people who injected opioids. HIV prevalence among people who inject drugs is more than thirty times the average prevalence.

OAT can help reduce these numbers. A patient stabilized on a daily oral dose of medication no longer feels the same degree of craving to inject other opioids, and the needle-sharing that drives infection stops.

So, the national scale-up of opioid agonist therapy began in 2007-08 through the National AIDS Control Programme. The goal was explicit: to reduce needle-sharing and HIV prevalence among those who inject opioids. At the time, this made sense; people who injected drugs made up a large and growing proportion of new HIV cases. India needed to reduce new HIV infections, and that meant OAT for injection drug users.

Even this was politically challenging. Since buprenorphine and methadone are opioids themselves, critics called the government an “official drug dealer.” In some ways, the government appeared to agree; the 2012 National Policy on Narcotic Drugs and Psychotropic Substances described OAT as treatment in which “an injecting drug user is supplied buprenorphine or methadone and persuaded to abuse them orally instead of injecting heroin or other drugs.”

The government treated OAT as if it were a stop on the way to recovery—a slightly shameful stop at that. The policy went on to impose a one- to two-year cap on agonist treatment, insisting that patients be switched to “de-addiction as soon as possible preferably within one year but in no case later than two years.” 

There is no scientific basis for this time limit. Opioid dependence changes brain chemistry in ways that take many years to reverse, not just one or two. A recent cohort study of 32,000 US veterans that tracked treatment durations of up to six years found that survival kept improving with each additional year on treatment, and that the commonly recommended six-month minimum was “likely insufficient, regardless of the patient’s individual mortality risk.”

As one review put it, the question isn’t how to get patients off medication; it’s why we’d want to when they’re already doing well on it. This is why the WHO, since 2009, has recommended that “in most cases, treatment will be required in the long term or even throughout life,” and that this “should not be seen as a failure, but rather as a cost-effective way of prolonging and improving the quality of life.”

And yet, as recently as 2022, newspaper articles ran with headlines like “Punjab’s OOAT6 plan goes awry, addicts get hooked on treatment pills!” In 2023, Punjab’s health minister complained that despite improving access to medications, there weren’t enough patients who had been “cured” of opioid use disorder. But this is a fundamental misunderstanding of opioid use disorders. It is like asking for a cure for diabetes or hypertension. For opioid use disorder, cure is possible, but unlikely; consistent, managed treatment works for nearly all patients. 

Embedding OAT within the HIV program was, in part, a way to borrow the institutional legitimacy and international funding that HIV treatment provided. This was a pragmatic choice; few would argue against reducing HIV infections. But there were significant tradeoffs. Because OAT was built as an HIV prevention tool, the program of the National AIDS Control Organisation (NACO) only registers patients who inject drugs. But this leaves out almost 90% of those who could benefit from OAT. The other 7 million people smoke or “chase” heroin, drink opioid concoctions, or take pills — and they can’t access NACO-affiliated treatment centers.

Where do non-injecting opioid users go instead? Government de-addiction centers offer short-term inpatient detoxification: patients are stabilized, withdrawn from opioids over days or weeks, and then discharged. But relapse rates after opioid detoxification are as high as 90%, with most patients relapsing within weeks of discharge. This is because detoxification only clears the drug from the body. It doesn’t undo what months or years of opioid use have done to the brain. Long after withdrawal, cravings persist, the ability to feel normal pleasure doesn’t return immediately, and the body continues to be sensitive to stress.

Worse still, patients are at high risk of overdose after detox. During detox, opioid tolerance drops sharply. When patients relapse, and most do, they return to doses their bodies can no longer handle.

Recently, India has begun to include non-injection opioid users in their treatment plans. Drug treatment clinics have been set up in government hospitals to provide OAT to anyone with opioid use disorder, not only those who inject. But by 2019, there were only 27 such clinics across the whole country. Clearly, this does not suffice to serve 7 million patients.

Punjab is the one place in India where this approach has been scaled.7 Government-run outpatient clinics now accept any opioid-dependent patient regardless of injection status. 

Evidence-Based Policymaking

There is another significant problem. Indian policymakers haven’t faced the scale of the crisis. The government’s programmatic mapping exercise, conducted between 2020 and 2022, estimated there were about 289,000 injection drug users in India. But the Magnitude of Substance Use in India study, conducted by the All India Institute of Medical Sciences (AIIMS) and the Ministry of Social Justice and Empowerment in 2018 put the number at about 850,000. The latter number is likely more accurate as it is designed to capture hidden populations away from obvious hotspots.

Different parts of the Indian government use each figure; the Narcotics Control Bureau has since adopted the higher figure, but the National AIDS Control Organisation, which runs the OAT programs, uses the lower one. Planning for the lower number will leave half a million injection drug users out in the cold, and it certainly leaves no spare capacity to reach other types of opioid users.

Even if there were only 289,000 opioid users, India simply doesn’t have the clinics it needs. In the decade to 2023, the country went from essentially zero national OAT coverage to 393 centers. Punjab has added a further 529 clinics. But just short of a thousand clinics can hardly cover 7 million people across 28 states.

The situation for women is particularly bleak. Women who undergo treatment in women-only centers show less substance use and criminal activity compared to those in mixed-gender programs, but there are only four women-only drug de-addiction centers in the entire country.

There are viable solutions to this dearth of treatment facilities. If community health centers and primary care physicians could prescribe and dispense OAT, the number of access points would increase dramatically without the need to create new centers. As of 2023, India already had over 30,000 primary health centers and about 170,000 sub-centers. Even a small fraction of these offering OAT would radically increase coverage.8

Beyond Government Clinics

In a country the size of India, though, government-affiliated clinics probably won’t be enough. Private providers can help fill this gap. This is relatively common across countries that provide OAT; Iran, for instance, has more than 7,000 private outpatient clinics dispensing OAT.

In principle, Indian psychiatrists could follow Iran’s example. There are private de-addiction centers in India, and private psychiatrists are legally permitted to prescribe buprenorphine. In practice, very few facilities offer OAT because private psychiatrists simply don’t want to take the risk.

Prescribing buprenorphine is a regulatory grey zone, with conflicting directives. Buprenorphine is simultaneously regulated under four different legal instruments: the Narcotic Drugs and Psychotropic Substances Act 1985, the Drugs and Cosmetics Act 1940, the Mental Healthcare Act 2017, and separate Drug Controller General of India approval conditions, and none of these agree on who can stock, dispense, or prescribe the drug. In the past, psychiatrists have been arrested for providing buprenorphine without the right licenses.

Consider (again) the example of Punjab. While it has had success in expanding government-affiliated clinics, private clinic expansion has not gone so well. In 2019, the Drug Controller General of India issued a directive that private psychiatrists could dispense buprenorphine from their own clinics. But, before the rules could take effect, the Punjab and Haryana High Court stayed the change. In 2020, the state’s cabinet amended its rules to allow private clinics to dispense anyway, but, by 2021, that provision had been rescinded. Four years later, in June 2025, citing the shortage in the public system, the Punjab health minister announced that private psychiatrists would be allowed to dispense in their outpatient departments. But, within weeks, the 2019 stay resurfaced as a legal barrier, and the health department set up a committee to decide how to get it vacated. In October 2025, the state cabinet issued new rules that specifically allowed individual psychiatrists to provide OAT without running a full inpatient rehab, but, within weeks, a public interest petition was filed challenging the rules. The petitioner argued the outpatient-only category was inconsistent with the Mental Healthcare Act and would encourage unregulated dispensing and diversion. At the time of writing, the matter was pending before the Punjab and Haryana High Court.

Unsurprisingly, all this flip-flopping has put private practitioners off OAT entirely. No official count of private facilities has ever been published, but the number appears negligible. In India, prescribing OAT may be harder than prescribing the opioid itself.

A Dosage That Causes Suffering

Even if a patient can reach one of the few government-affiliated clinics, the current system makes it difficult for them to stay in treatment. For a start, clinics radically underdose patients.

India’s early experiments with buprenorphine in the 1990s used very low doses of 1.2 to 2 mg per day, in part because only 0.2 mg tablets were available at the time. After larger doses became available in the 2000s, a very small-scale local study in India compared the efficacy of 2 mg and 4 mg doses. It showed no difference in efficacy, likely because the study only had 23 patients. Indian policymakers stuck with the lower, cheaper dose.

Unfortunately, early studies were misleading. The WHO now recommends 8 mg to 24 mg per day for buprenorphine maintenance. At lower doses, patients are much more likely to still experience withdrawal and cravings. Since patients still suffer the negative side effects of coming off drugs, they are much more likely to discontinue treatment. A meta-analysis found that patients on 16 mg or more stayed in treatment longer and tested clean more often than those on lower doses.

India has since updated its guidelines somewhat, but they remain far below international norms. More than three-quarters of patients at government-affiliated treatment centers were receiving less than 8 mg daily and, as a consequence, about 38% had dropped out by six months. There has been no attempt to see whether higher doses could reduce this dismal retention rate.

Increasing the dosage received at clinics to the WHO standard would not require major changes. Since dosing is centralized in a relatively small number of clinics, it would be relatively simple to require these government-affiliated clinics to provide at least 16 mg of buprenorphine daily in consultation with the patient. Since buprenorphine is so cheap, it would not even be a major strain on government budgets.

Barriers to Staying in Treatment

But let us say a patient can get to a clinic and tolerate the ongoing cravings. India’s clinics still make it difficult to stay in treatment. Indeed, they give patients a seemingly never-ending series of obstacles.

When a patient starts OAT, the consent form requires a family member or witness to co-sign, and patients must agree to bring family along for follow-up visits. At many centers, this means a patient cannot begin treatment without first disclosing their addiction to a relative. Given the severe stigma of opioid addiction, that is not a small ask.

The family obligation doesn’t stop at registration. On weekends, when clinics are closed, a family member must collect the patient’s doses and supervise them at home. The patient cannot take the medication unattended. The logic behind this is that families support recovery and that involving them early builds a structure around the patient. But not everyone has a willing family member, particularly if they have struggled with opioid addiction that has strained family relationships.

The logistical difficulties do not end there. In India, OAT requires daily attendance at a clinic. Medication is given as a small tablet, often crushed and placed under the tongue. Staff watch it dissolve so it can’t be pocketed and carried out. But most clinics are only open from 9 am to 4 pm. When travel to and from a clinic is included, treatment can take hours a day, and most of those hours must be during the workday. In a country where many laborers work in informal jobs without the ability to even discuss taking time off, it can seem easier to discontinue treatment than to try to manage the logistics.

Seasonal migration makes these constraints even harder to navigate. In India, it is estimated that between 2% and 6.8% of people migrate seasonally. But when clinics require frequent in-person attendance, OAT becomes difficult to sustain. In a set of interviews with young people who inject drugs in the northeast state of Mizoram, one patient described the problem:

“We went to my wife’s village. We expected the length of our stay to be one week, one week and a bit. But they could not give us too many OATs. Maybe it was two or three days’ dose; they gave us just that. During that time, if I didn’t take it, I still had to suffer.”

So, people adapt. For travel, they borrow doses from others at the clinic, then smuggle out their own daily allotment after they return to repay the loan. In Punjab, researchers have documented this barter system among truck drivers whose trips can last a month. Most of the “diverted” buprenorphine is probably consumed by people already in treatment, not by new users chasing a high.

In many countries, take-home OAT is much more common because they have adopted an important technological improvement. Rather than using just buprenorphine, they use buprenorphine combined with naloxone. In this formulation, an opioid-like molecule, buprenorphine, and its antagonist, naloxone, are combined. When you swallow the tablet, naloxone is poorly absorbed and has little or no effect, while the buprenorphine works as expected. But if someone dissolves and injects the tablet to get high, the naloxone blocks the opioid receptors and triggers withdrawal symptoms. This means it is safe for take-home dosing since the patient can’t get high on it even if they try.

The combination works well elsewhere. In the United States, buprenorphine is prescribed like any other Schedule III medication, with patients receiving up to a month’s supply at a time. The longer patients stay on treatment, the better the outcomes. We know that the combination product—buprenorphine mixed with naloxone—is as effective as buprenorphine alone, suppressing withdrawal and cravings. 

While there have been concerns that the effects of naloxone may be too short-lived to prevent diversion in all forms, there is some concrete evidence that its design to deter abuse works. Patients prescribed buprenorphine-naloxone consistently report injecting it for misuse less often than those on plain buprenorphine. Weekly injection rates in Australia ran roughly half those of buprenorphine alone, daily injection rates among Finnish needle-exchange participants about a fifth, and US surveillance data show a similar gap.

This combination does exist in India. The buprenorphine-naloxone combination was launched in the country in 2004-2005. It is not clear why it hasn’t become the standard medication of choice for take-home dosing.9

But during the COVID-19 pandemic, India experimented with longer dosing. NACO allowed take-home buprenorphine for the first time, with centers dispensing at least seven days’ supply, and even up to four weeks’ provision in some tertiary centers. A retrospective cohort study at one North Indian tertiary center compared patients given a 1- to 2-week supply before the pandemic with a cohort given up to 4 weeks during it. The longer-prescription group stayed in treatment longer.

But even the combination therapy is just a better version of the same daily pill. The science has moved further along. In April 2026, the WHO added long-acting injectable buprenorphine to its treatment guidelines, recognizing that a monthly injection eliminates the need for daily clinic visits that drive patients out of treatment, and removes the diversion risk that drives daily dispensing recommendations. And even better options are on the horizon: subdermal implants could offer six months of steady medication from a single procedure, and early research on GLP-110 receptor agonists like semaglutide suggests they may reduce opioid cravings. Trials are in progress in the US right now, but there are no such trials in India. India must move beyond 1990s science and find the best ways to treat its large opioid-dependent population.

Fixing the Problem

It is not that India lacks the medicine or the money to treat opioid addiction. Rather, it is that the country’s opioid treatment system was built on a deep mistrust of the people within it. Patients are treated like addicts without the willpower to get clean, not as people dealing with a physiological dependence. Every choice in the system underlines that reducing the risk of misuse outweighs any suffering patients may experience along the way.

Sankey diagram of accessing OAT in India
Sources: Ambekar A et al. on behalf of the group of investigators for the National Survey on Extent and Pattern of Substance Use in India (2019); NACO program data; Ganapathi et al. (2023)

Most of these choices can be unwound, and most without much money. India can plan for all those who are dependent on opioids, not just the ones the government deems acceptable to count; raise government clinic dosing to the WHO range; make buprenorphine-naloxone the default take-home medication; and let primary health centers and private clinics prescribe and dispense without putting themselves in legal jeopardy.

None of these require inventing anything. The evidence base is decades old, the international playbook has been successfully followed in many other countries, and India is well-placed to implement a better system. Indian patients should not need to suffer any longer.

Cartoon of opioid users being rescued by helicopters - but there aren't enough ladders or helicopters to help everyone.

Akshay Narayanan is a public health researcher and consultant working on treatment for young people with opioid use disorders in India and violence prevention in schools across low- and middle-income countries. He previously led child protection programs for Guardians of Dreams, and writes about how young people shape the world and how the world shapes their lives.

If you have comments on this article, or wish to contribute to the discussion, please email them to letters@indevelopmentmag.com. Responses will be featured in a letters section.

  1. As calculated from prevalence numbers from the World Drug Report 2025. Some sources have the US as having a slightly higher number of people with opioid use disorder; given the difficulty surveying this population, there is some variation among sources. ↩︎
  2. This cost-effectiveness estimate is from the US; no similar estimate exists in the South Asian context, despite nearly two decades of OAT delivery in India. ↩︎
  3. India’s National Crime Records Bureau reported about 3,000 drug-related deaths between 2019 and 2023 but this figure is universally regarded as a severe undercount. As Singh and Rao (2012) note, opioid overdose deaths in India are routinely registered as “cause unknown” or as exposure to cold or heat, particularly among the homeless. The figure also captures only “accidental” opioid overdose. It excludes the far larger toll of drug-attributable mortality from HIV and Hepatitis C transmission through shared needles, injection-related infections, and mental health comorbidities. The true baseline against which any treatment scale-up would operate is almost certainly an order of magnitude higher than the official count.

    Scaling OAT from 2% to 25% would put an additional approximately 1.77 million Indians into treatment. Of those, baseline annual mortality would be about 18,000 to 27,000. Applying Sordo’s 55% reduction in all-cause mortality only to the fraction meaningfully retained in treatment (assume even half, given conservative retention rates) yields roughly 4,900 to 7,300 lives saved per year from mortality reduction alone. ↩︎
  4. Some heroin users inject, although in India it is more common for heroin to be smoked. ↩︎
  5. As of December 2022, Vietnam had 235,314 registered drug users, of whom 84.7% use opioids. There are 52,000 people in treatment, which is about 25%. ↩︎
  6. Outpatient Opioid Assisted Treatment. ↩︎
  7. There are now 529 such clinics in Punjab. ↩︎
  8. Indeed, this is precisely how Punjab has been expanding access to OAT to address its growing opioid crisis. ↩︎
  9. Perhaps it is because the NACO guidelines reference only plain buprenorphine. Given the legal uncertainties, it does not make sense for prescribers to push for something not explicitly covered by regulation. ↩︎
  10. Glucagon-like peptide-1 ↩︎