

AI could reshape the pathways to economic growth. Those looking to grow will adapt to that. Predictions of our economic futures should account for both.

Three years ago, workers in Kenya made international headlines for the conditions they experienced while labeling data for OpenAI. These workers spent their days sorting through hate speech, sexual abuse and violent images — some of the most disturbing material on the internet — for around $1.35 an hour. The labels they produced were then used to help train ChatGPT to identify toxic or disallowed content.

In 2023, much of the outrage was focused — rightly — on the working conditions of these data labelers. But revisited in 2026, this story takes on another dark cast. 

Amid a new wave of AI anxiety, people have begun to fear that the broader category of IT service jobs may disappear entirely. Under this view, by helping to train ChatGPT, these workers may have inadvertently been helping to automate away the very kind of tradable service work they performed, narrowing Kenya’s path to prosperity. 

But how much evidence is there that AI-related displacement has actually begun in developing countries? And how should we forecast what comes next when the workers, firms and countries affected by AI will themselves adapt, improvise and change in response?

Climbing the Growth Ladder

Historically, manufacturing growth has been the path for countries out of poverty. In Japan, South Korea, Taiwan and, most spectacularly, China, the expansion of export manufacturing pulled millions of people from the farms to better-paying jobs in factories. Under the pressure of international competition, East Asian firms quickly converged to the technological frontier.

But, outside of a few bright spots like Vietnam and Bangladesh, developing countries have largely failed to replicate the success of East Asia. In India, the manufacturing share of GDP has never exceeded 20% and has even declined since 2010. In sub-Saharan Africa, manufacturing makes up around 10% of GDP. New analysis suggests that over the past 30 years, manufacturing productivity in the poorest countries has stubbornly remained far below the global frontier.

Enter IT services.

The arrival of cheap broadband across the world made the outsourcing of information technology services viable for Western companies, enabling them to take advantage of cheaper labor in developing countries. In 1999, India deregulated its telecom sector, accelerating the adoption of high-speed internet and allowing new firms like Infosys and Wipro to become highly profitable. A new sector — in India, “business process outsourcing” (BPO) — was born.

For countries struggling to get growth off the ground, BPO seemed like a lifeline. Like the export manufacturing jobs of yore, export services held out the promise of generating significant foreign exchange revenue while also creating a large number of better-paying jobs. In 2021, the World Bank published a report extolling “the promise of services-led development,” highlighting their exposure to “innovation that improves labor productivity.”

Over the past few decades, countries like the Philippines and Brazil have developed sizable IT sectors, exporting billions of dollars of services a year and employing close to 2 million workers apiece.1 But, globally, the clear leader of the pack was India, whose IT services sector employed 5.8 million people and exported $200 billion in 2025:
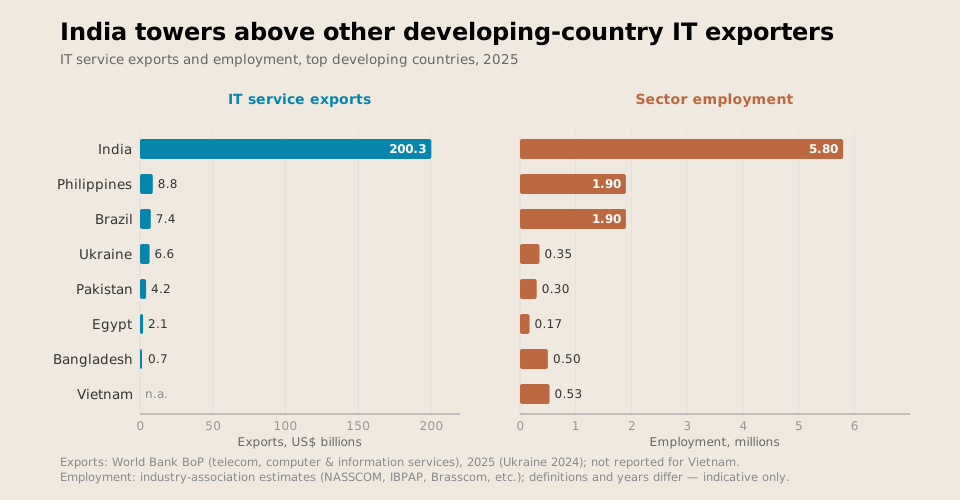
Graph showing much higher employment in the IT export sector in India than in any other country
India is patient zero for any changes to the IT export sector.

The fear of AI replacing human jobs is now ubiquitous. In America, attention has become fixed on the disruption of entry-level jobs in software development and customer service — the proverbial canaries in the coal mine, the work that should (at least in theory) be most easily automatable by AI coding agents. An influential paper by economists Erik Brynjolfsson, Bharat Chandar and Ruyu Chen found that early career workers (22-25-year-olds, in the U.S.) in the most AI-exposed sectors have seen a 19% relative decline in their employment since 2022. 

Naturally, attention has started to shift to AI’s implications for the 6.8 billion people who live in low- and middle-income countries. Thus far, AI has not had much of an impact, positive or negative, on the 2.5 billion people who still depend on smallholder farming. In manufacturing, the evidence for impact is also limited, though perhaps AI-induced advances in industrial robotics are coming down the pike. It is in service exports that the threat of AI-related job displacement looms the largest. 

The Canaries in the Coal Mine

It has now been four years since the launch of ChatGPT. Agents are able to do much of the work of customer service; indeed, corporate support lines have been increasingly replaced with a ChatGPT or Claude wrapper. So how much is automation already displacing service exports in the developing world?

We can take a page from the recent research on AI-exposed displacement by Brynjolfsson et al. in the United States and look at how employment is evolving for the people we’d expect to be most exposed to AI displacement: entry-level tech workers.2

Perhaps the best available data from any developing country comes from India’s Periodic Labour Force Survey (PLFS), a high-frequency look at trends in employment and wages.3 We can use what economists call a “triple difference” to pinpoint the effect of AI exposure. First, we take employment for young workers (those 15-24 years old) in AI-exposed industries and subtract the trend for older workers (those 25-39) in the same industries. Then we can do the same comparison of young versus old in industries largely insulated from AI. Last, by taking the difference between these two differences, we can isolate the shock to entry-level work in the industries most exposed to AI.
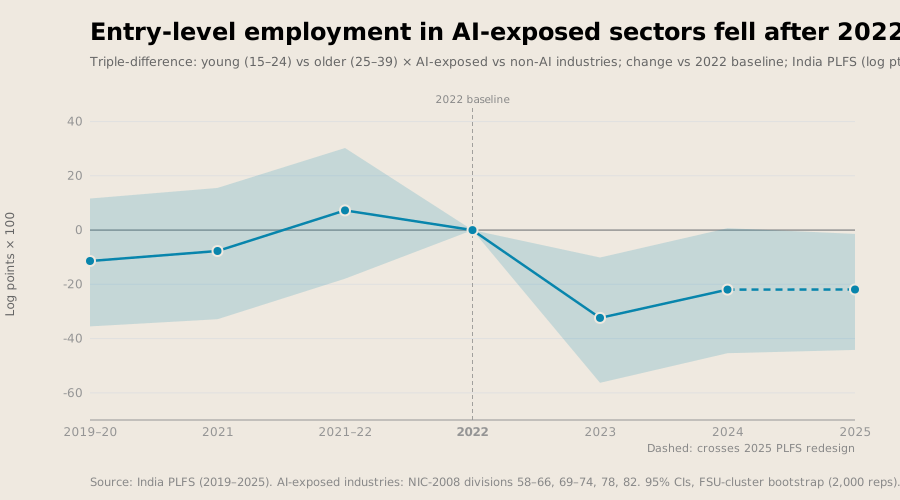
Chart showing a fall in IT sector employment after the launch of ChatGPT
Employment of entry-level IT workers has fallen after the launch of ChatGPT. Analysis of PLFS data by the authors.

The chart above shows this triple difference on employment, with confidence intervals marked by the vertical bars. For the three years before ChatGPT, there was little gap between entry-level and older workers in the most AI-exposed and non-exposed industries. But after 2022 — the year ChatGPT was released to the public — relative employment for the youngest, AI-exposed workers suddenly fell 32%. Relative employment has not recovered since, remaining around 20% below the 2022 baseline in the latest 2025 snapshot.
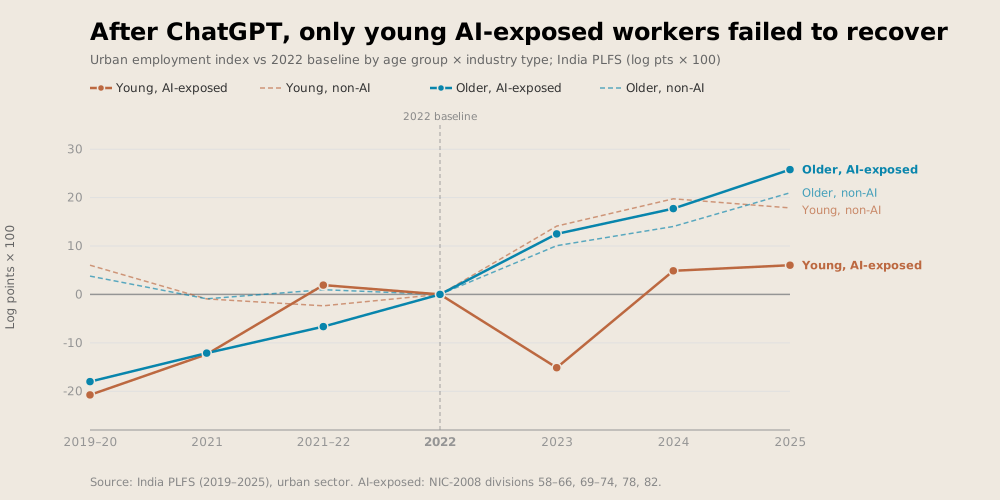
Chart showing young AI-exposed workers are still below trend for employment
Employment for other workers has rebounded since 2022, but entry-level IT worker employment remains below trend. Analysis by the authors.

We should be careful about overreading this result. It’s possible that the decline reflects structural forces that were occurring at the same time as the rise of generative AI. For instance, some Indian IT firms overhired during the pandemic and froze graduate hiring in 2023.

The absence of a robust employment recovery — amid rhetoric from the BPO companies themselves about increasing AI adoption — gives a hint that the effect may be real. Incidentally, this echoes the result in the latest revision of the work by Brynjolfsson and his coauthors, where the 19% drawdown in employment for AI-exposed young workers has shown no sign of disappearing.

But we should not take this as a sign that all the jobs are going away. This data is from one sector, in one country, among those workers we expect to be most affected. There is (as yet) no evidence of a generalized downturn across all age categories or AI-exposed sectors. Even this result is barely statistically distinguishable from zero.

How and when can we draw clearer conclusions? It may be longer than we’d like — in most other developing countries, data comes with far more of a lag.

Flying Blind Since Takeoff

“Gentlemen, you have come 60 days too late. The depression is over.” Herbert Hoover, June 19304

In 1930, the Depression was very much not over. But how was Hoover to know? This was before Kuznets’ “National Income” report was presented in 1934, the precursor to modern national income accounts and GDP. It was also before reliable monthly unemployment statistics were available, as the modern household survey did not begin until 1940.

Many of today’s leaders, particularly in low- and middle-income countries, find themselves in a similar position to Hoover in the 1930s — entering a period of economic transformation blind to how their economies are actually changing in real time. India’s PLFS is a remarkable effort, and one for which there is no equivalent in other countries that might be similarly vulnerable to an IT exports shock.

Take the Philippines, another country with a significant service export sector. Their annual survey of business and industry is released more than one year after the period it studies. This makes it nearly useless in analyzing high-frequency labor force changes in response to changes in AI capabilities. It might not be until Fable 8 is released that we can fully disentangle the impact of Fable 5 (and today’s other frontier models) on the Philippines IT sector’s labor force. There simply is no real-time tracking data.5

With the attention and money now flowing to AI economics research, we are likely to be bombarded with similar estimates to our own, from hot-off-the-press working paper abstracts that tell us how AI has displaced some category of worker relative to another or boosted productivity in some company relative to another. 

So it will also be tempting to overread the data we do have — to dash off a Twitter thread that launches into the coming employment apocalypse facing India’s young IT workers. But each result is only one piece of the puzzle. This result — and others like it — don’t tell us about overall impacts.

And then, there’s only the small matter of projecting this out into the future. Even if we could perfectly understand economies today, simply extrapolating that out to meet the capabilities of tomorrow’s models could lead us to highly misleading forecasts.

Not-So-Dumb Farmers and the Population Bomb That Wasn’t

Many of the fears about AI’s economic effects arise from projecting the effects of future technologies on a world that looks broadly similar to the one today. But these kinds of extrapolations have a long and checkered history, as we humans tend to be far more adaptable than we give ourselves credit for.

Perhaps the most infamous prediction in international development comes from Paul Ehrlich’s 1968 bestseller “The Population Bomb.” Extrapolating out observed trends in population growth and limited progress in food production, Ehrlich was alarmed by the possibility of overpopulation and mass starvation. The most optimistic scenario presented in “The Population Bomb,” which required “a maturity of outlook and behavior in the United States that seems unlikely to develop,” involved the death by starvation of half a billion people (one-fifth of the world’s population).6

But Ehrlich’s projections were based on static extrapolations of human behavior. He failed to anticipate the Green Revolution, which dramatically improved grain yields (particularly in India), and the Demographic Transition, in which fertility fell. Deaths from malnutrition and famines have actually decreased. Ehrlich bet against our oft-underappreciated ability to innovate and adapt, by imposing a rapidly growing population onto a future world whose productive possibilities changed too slowly. 

Indeed, the Y2K episode,7 the demand shock that supercharged India’s IT export sector, is another example of predictions not holding up to adaptation. This time, before the clock struck midnight on December 31, 1999, adaptation came in the form of coders in India inspecting and modifying millions of lines of code in order to avert disaster. In the end, apocalyptic predictions of financial, government and transport systems simultaneously crashing across the globe never came to pass, as we adapted to ensure they didn’t.

Climate economics, too, has learned a similar lesson over recent decades. Early models of the agricultural damage from climate change often took projected temperatures, ran them through equations of crop yields at different temperatures and projected out damages. Predictably, the estimated climate damages in this early generation of predictions tended to be enormous. But these models baked in the critical assumption that farmers would not adapt to a changing climate.

There will still, of course, be large costs from climate change. And not all adaptations are successful: In U.S. agriculture, adaptations over the long run have mitigated at most half, but most likely none, of the damages from climate change. There are real constraints to adaptation — even where there is a will to adapt, there is not necessarily a way to do so.

AI may play out the same way as these previous challenges. There will likely be losers from adaptation. There may even be thresholds at which the ability to adapt runs out. But if you are guesstimating what the world will look like in five or 10 years’ time, you may end up being very wrong if you neglect our future selves’ ability to adapt. Tomorrow’s AI will meet tomorrow’s world, not today’s.

This points us to one small but perhaps constructive suggestion for economists. For the past 20 years, causal inference — the ability to cleanly separate cause and effect — has been the sine qua non of academic economic research. By contrast, forecasting has been relegated to secondary or tertiary status, the domain of policy people and (shudder) bankers. 

That division of labor made sense when we could reasonably expect that the world of tomorrow resembled the world of today. But if AI really is about to reshape the pathways to growth, the most useful thing economists can do is not to measure yesterday’s shock ever more precisely but to get better at predicting the next one.

More accurate visions of our economic futures must account for both machines’ capabilities and humans’ adaptabilities. Just as humanity didn’t sit around waiting to starve, business executives at Infosys are not sitting around waiting to be replaced. There might be fewer jobs to go around, or different types of jobs, but if there’s anything they can do about it, the industry born out of adapting to a crisis will try to adapt once more.

Oliver Kim is a development economist working as a Research Fellow on Coefficient Giving’s Global Growth Fund.8 He writes a Substack called Global Developments. Oliver Hanney is a contributing editor at In Development, and is the managing editor at VoxDev, where he hosts the Ideas in Development podcast.

If you have comments on this article, or wish to contribute to the discussion, please email them to letters@indevelopmentmag.com. Responses will be featured in a letters section.

  1. The OpenAI story was relatively unusual in featuring African workers; Kenya’s sector employed just 36,000 people in 2025. ↩︎
  2. It is likely that older tech workers have acquired both more “soft skills” and more specialized technical skills, making them more difficult to replace with AI. ↩︎
  3. The PLFS’s methodology was revised in 2025, making backwards comparisons tricky. Nonetheless, it’s the best data that we have. ↩︎
  4. Exact wording is uncertain, but he most likely did say something along these lines. ↩︎
  5. There is a growing body of research exploring new forms of measurement, e.g., machine-learning enabled nowcasting, satellite data, mobile phone data and automated classification. It remains to be seen whether new approaches like these can leapfrog the need for traditional administrative and survey data sources. ↩︎
  6. Paul Ehrlich, The Population Bomb (Sierra Club Ballantine Books), 80. ↩︎
  7. Originally known as the “Millennium Bug”; many computer programs stored years using just two digits, leading to widespread fears that systems would mistake “00” for 1900 and crash en masse on January 1, 2000. ↩︎
  8. Another team within Coefficient Giving, the Effective Giving & Careers team, is a funder of In Development. They played no part in our editorial decision to commission, edit and publish this piece, and Oliver is writing in his personal capacity. ↩︎

The U.S. is now operating an aid program without an aid agency.

In the first few months of 2025, the U.S. foreign aid program as we knew it ended. Initially, the Trump administration announced a “pause” while the new administration reviewed spending. The pause concluded with the announced termination of about 83% of all awards from America’s flagship assistance institution, the U.S. Agency for International Development (USAID). This resulted in a cut of around $13 billion in foreign assistance almost overnight, with whole sectors of support effectively shut down.

As part of that process, USAID itself was dismantled. Nearly all of its 10,000 staff were terminated, along with as many as 280,000 people providing contracted services. Although the legal structure of USAID remains, and a number of court cases over its shuttering are unresolved, it is unlikely to return in any similar form.

But foreign assistance continues. The administration has resumed spending and has even begun issuing some new awards. Congress has budgeted funding for a program with much of the scale and breadth of 2024 and earlier. In essence, the U.S. is now operating an aid program without an aid agency. In no small part, the future impact of U.S. foreign assistance will depend on whether, when and how that changes.

Following the Money

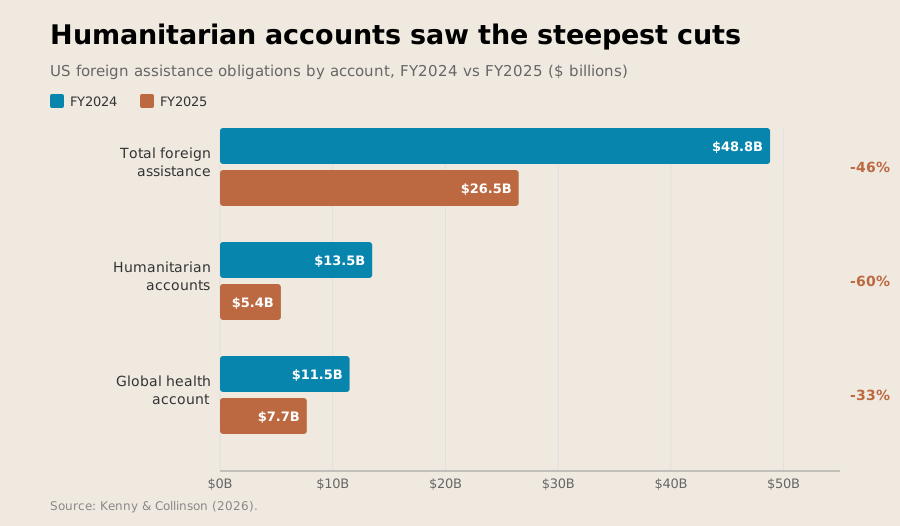
Spending fell far and fast. Total designated international development and humanitarian assistance outlays (current spending) under fiscal year 2024 — the period October 2023 to September 2024 — totaled more than $41.4 billion; in fiscal year 2025, that fell to $33.3 billion.1 Commitments to future spending (obligations) dropped more substantially from nearly $48.8 billion to $26.5 billion.2

Most health and humanitarian spending categories were comparatively protected from immediate cuts, but humanitarian spending in particular saw a steep drop-off in new obligations. From fiscal year 2024 to fiscal year 2025, the two main humanitarian accounts saw obligations decline from $13.5 billion to $5.4 billion, while obligations from the primary global health account declined from $11.5 billion to $7.7 billion.

Chart showing humanitarian aid was cut more than global health aid
While all foreign assistance faced significant cuts, humanitarian accounts were hit the hardest.

Through the end of the second quarter of fiscal year 2026 on March 31, total outlays across the major foreign assistance budget subfunction still had not recovered, running at 72% of their level at that point in fiscal year 2024 and obligations at 74%. More detailed data on sectoral and country-level funding across U.S. assistance programs was delayed, but USAID spending for fiscal year 2025 suggests the only sectors to see rising obligations from the agency compared to the prior year were those tackling tuberculosis and malaria.

Chart showing cuts by sector
Almost all sectors faced cuts, but the overall impact was highly heterogeneous by sector; some sectors were cut by >80% while others received modest increases.

Spending in USAID-related accounts largely followed the patterns of early cuts. Sectors only subject to a small (less than 10%) cut included nutrition and support for Ukraine. At the other extreme, a number of sectors saw obligations fall by more than two-thirds: good governance, policies and regulations, trade and investment, private sector competition, civil society, political competition, water supply and sanitation, agriculture, disaster readiness and “other public health threats” (those beyond pandemic preparedness and major infectious killers).

The geography of aid has also changed. Zimbabwe, Burma, DR Congo, Yemen and Syria saw more than a two-thirds cut in USAID obligations between fiscal years 2024 and 2025 — a combined decline from $3,205 million to $816 million. Afghanistan faced a reported 100% cut to future aid obligations. At the relatively less-affected end, Egypt, Pakistan and Jordan all saw their obligations fall by 15% or less, while Lebanon saw a small increase.

Declines in spending were more than matched by declining capacity to deliver assistance. Out of the 10,000 USAID staff, only about 700 (around one in 14) were absorbed into the State Department to help it run former USAID programs. State itself also saw staffing cuts. Each of the remaining staff responsible for transferred awards now covers a much wider remit; State Department contracting officers overseeing foreign assistance were estimated to be responsible for managing about $260 million in awards each, compared to $65 million per contracting officer at USAID in 2022.

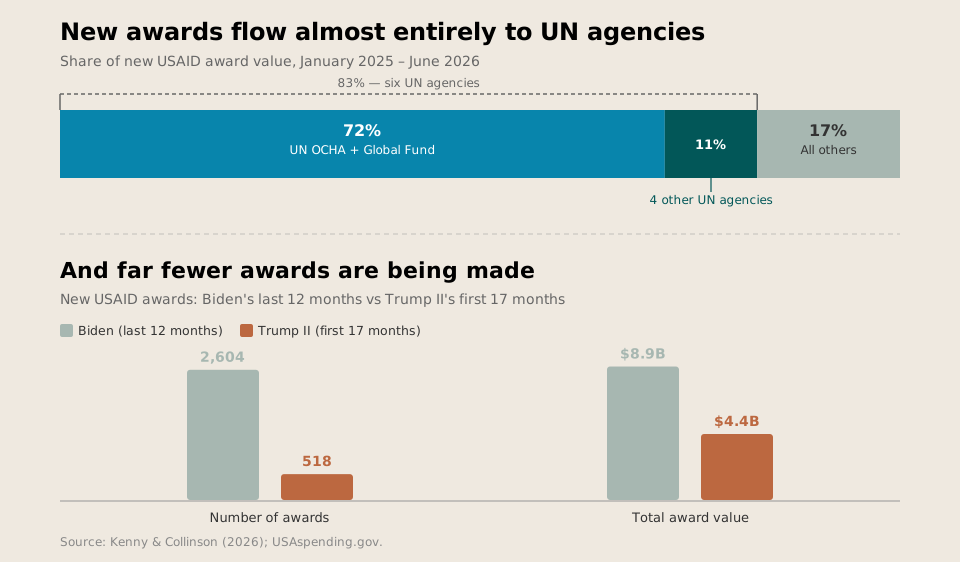
Perhaps unsurprisingly, this resulted in falling behind on payments to remaining contractors and contracts, and a significant lull in developing any new projects. About three months after the end of the initial foreign assistance pause, new spending obligations were still running at a third or less of the level of the past. It was nearly a year before there were any significant new awards. USAspending.gov data suggests that by the start of June 2026 the administration had awarded 518 contracts and awards under the main foreign assistance accounts in the 17 months since coming to office, compared to 2,604 in the last 12 months of the Biden administration. While the pace has picked up over time, the combined value of awards is still much lower. By June, the Trump administration had awarded $4.4 billion over 17 months, as compared to $8.9 billion in the last 12 months of the previous administration.

Impact

Prior to the pause, U.S. foreign assistance delivered measurable impacts across a range of sectors, including education, infrastructure, agriculture and violence prevention. USAID was particularly strong in delivering global health and humanitarian assistance, where it supported interventions estimated to save more than 3 million lives a year.

Given the size and breadth of the portfolio, even carefully executed budget cuts would likely have led to lives and livelihoods lost. The approach taken by the administration was some distance from well thought through. For example, there was an official waiver system to allow lifesaving assistance to continue during the aid pause at the start of 2025, but a chaotic situation in which most staff were placed on administrative leave prior to termination, rules and definitions regarding waived assistance were unclear and exceptions required senior management approval meant it was largely ineffective. Even aid that was officially allowed to continue through the pause largely ceased.

Other donors did not step in to fill the resulting gaps — indeed, the global total of aid from countries other than the U.S. fell in 2025 and 2026. Germany, the United Kingdom, Japan and France, notably, all cut foreign assistance last year. Recipient governments in some countries did try to respond, not least South Africa, which largely mitigated the impact of declining support for antiretroviral delivery. But the broader picture was considerably less positive. Most aid that was cut was not replaced.

Many people died as a result. However, the short-term mortality impact was likely less than initial cuts and forecasts suggested, thanks in part to the resumption of U.S. assistance in mid-2025.

At that point, the U.S. government focused on restarting some of the most effective lifesaving approaches alongside triage and unfunded continuation of services by providers. The flagship U.S. global HIV program, PEPFAR, which backs services preventing perhaps 1.6 million deaths a year, is a case in point. Much of the early coverage of the pause focused on this program. But by the end of fiscal 2025, antiretroviral treatment supported by PEPFAR had nearly recovered to the previous year’s levels. At the same time, coverage is still meaningfully worse than it was a year prior, new enrollments in treatment declined, services aimed at harder-to-reach communities appear to have been significantly reduced, testing levels fell to rates not seen since COVID-19 disruptions and a range of prevention activities (including pre-exposure prophylaxis) were significantly curtailed. This all suggests the risk of significantly slower progress against the global HIV epidemic in the years to come — and higher mortality as a result.

Regarding other areas of global health, there were significant cuts to maternal and child health, but in the end, they were not as severe as originally predicted. Despite a delay in U.S. funding, Gavi, the Vaccine Alliance, delivered a record number of vaccine doses in 2025 — and it looks like funding from the U.S. will only be delayed, not rescinded. Preliminary data from USAID suggest rising spending on malaria-related activities, though we will not have a clear picture of the status of global malaria campaigns in 2025 until the WHO World Malaria report is issued in December.

The U.S. was also one of the major funders of global pandemic preparedness, a role tested by the 2026 Ebola outbreak in DR Congo. While pandemic and emerging threats saw a relatively modest 21% global decline in USAID obligations in fiscal 2025, and a $3 million U.S. disease surveillance project in DR Congo was given a waiver early last year during the spending pause, capacity has still been seriously hurt. In 2025, USAID obligations to the country fell by 68% compared to 2024, and U.S. capacity to react to outbreaks was hobbled by a lack of staff. Every member of the USAID team that had responded to a 2025 Ebola outbreak in Uganda was fired. There is no surge capacity elsewhere in the U.S. government, either; while the U.S. Centers for Disease Control has provided support, it has also been substantially weakened by cuts, losing some one-quarter of its workforce.

The evidence is less clear when it comes to the impact of humanitarian assistance cuts. What we do know is that the U.S. was a major financier of global humanitarian response, particularly in crises that got little attention from other funders, and that the U.S. cuts have occurred as the rest of the world has also become less generous, so that in 2025, global humanitarian funding per person in need was at less than one-third of the level of 2019.

And, at least initially, it appeared as though the U.S. would be considerably less ready to respond to new and growing crises. When an earthquake hit Myanmar in March 2025, it took days for a small U.S. response team to arrive, only to be told they were being laid off while working on the recovery effort. Ninety-five percent of the staff in the bureau that deployed disaster-response teams were fired. Between them, Afghanistan, DR Congo and Mozambique saw 6 million more people in need of food assistance in December 2025 than they did in November 2024. USAID spending in Afghanistan fell 28% between FY 2024 and 2025, in DR Congo 42%, and in Mozambique 30%.

It is very hard to quantify the health and mortality outcomes of the U.S. humanitarian retreat. Most humanitarian needs occur in settings with little administrative data; it is difficult to track what is happening and even more difficult to determine what the counterfactual would be. The cuts themselves hobbled global tracking capacity. It will be years, if ever, before we know the true toll from the disruptions.

It does seem likely that triage efforts helped; the sector attempted to make sure the most important needs were met, even with limited resources. Nonetheless, cholera deaths — a disease closely associated with humanitarian crises — may have doubled in Africa, and rising deaths were associated with declining U.S. assistance. There is worrying evidence of rising maternal and child mortality in refugee populations across Africa. Meanwhile, famine looms in Afghanistan and Yemen, where all U.S. food assistance has been withdrawn. And with crops being planted without fertilizer in response to rising prices driven by the U.S.-Iran war, the next 12 months will sorely test a dramatically weakened global humanitarian system. The World Food Program reported in June that there were already signs of millions of additional people worldwide being unable to afford a basic food basket adequate for nutrition.

The New Model?

The Trump administration does not intend to exit foreign assistance completely. But they have chosen to restructure how aid is delivered and who delivers it.

USAID is functionally dead; what capacity remains has been moved to the State Department. The intention seems to be for State to remain the primary foreign assistance organ through the remaining years of the Trump administration. Staffing has increased somewhat in response to State’s expanded portfolio but remains well below USAID levels.

This low staffing level has cemented the early decision to largely abandon smaller awards. The State Department is favoring large international organizations in their grants; the UN Office for the Coordination of Humanitarian Affairs and the Global Fund, between them, accounted for 72% of the value of all reported new awards issued from the start of the Trump administration up to June 2026. Add in four other United Nations agencies, and that climbs to 83%.

Chart showing that State is making far fewer awards and those they make largely go to UN agencies
Despite the administration’s stated preferences, funding has largely flowed to UN agencies.

This is in tension with the Trump administration’s stated priorities; administration rhetoric has focused on questioning the efficacy and accountability of multilateral organizations like the UN. However, this does not seem likely to change in the near term; 2026 awards have been just as focused on large organizations as 2025 awards.

For future awards, the administration is working to shift a bilateral global health program previously reliant on contractor and nonprofit delivery to one largely based on master agreements with recipient countries. Under these new agreements, governments will be responsible for coordinating supply chains, management and service delivery. Further payments from the U.S. will be contingent on achieving coverage and quality results.

It is also worth noting the types of awards the State Department is not making. There are relatively few small awards to nonprofits; there are also fewer opportunities to competitively bid for awards. Certain functions of USAID are not being replicated within State — there is no equivalent of DIV, which tried to incubate scalable interventions, or the Office of the Chief Economist, focusing on evaluation capacity.

Some of these changes have the potential to improve aid effectiveness. The Global Fund is recognized as being one of the more cost-effective large organizations in development. Flexible UN humanitarian funding can be directed where it is needed most while reducing some of the overlap and transaction costs of a system of competing agencies. And there have long been calls to abandon the parallel system of health care linked to U.S. health interventions, which use American contractors and nonprofits, and work directly with governments instead.

At the same time, future plans are unclear. The bilateral global health agreements promise to phase out U.S. spending over a five-year timeframe but offer scant details on how to ensure people receiving lifesaving support continue to have access to it and whether there will be a backstop to safeguard progress in tackling diseases in the event of government underperformance. And while a shift to local government provision may reduce overlaps in provision, it is a stretch to believe that low-income Liberia can provide the same quality and reach of U.S.-supported health services with 37% of the money. Department staff are still in the throes of negotiating implementation plans to operationalize the high-level agreements.

Again, whatever the efficiency gains of the administration’s “humanitarian reset,” the cuts are still large. It’s difficult to see how $3.8 billion in funding committed to the UN Humanitarian Coordinator could achieve what the $8 billion 2024 humanitarian budget could.3

The administration’s response to the June 24 earthquakes that struck Venezuela, where the State Department has highlighted a financial commitment of more than $300 million alongside military and search-and-rescue deployments, suggests there is still political will to mobilize for high-profile emergencies. But it is unclear whether the same would extend to crises in countries seen as less strategically important.

Furthermore, a focus on U.S. domestic benefits comes at a price to aid efficacy. Negotiations around health agreements in some countries have drawn criticism for making health aid contingent on data access, and reports suggest these agreements are, at times, advancing alongside discussions about securing access to critical minerals, raising questions about whether such ambitions will come at the cost of saving lives. USAID received criticism for being too political, but it seems that the State Department may be even more so — the Trump administration’s plan for aid puts U.S. interests at its core.

In part due to this focus, the State Department is also backing U.S.-based innovations as development solutions. This has included purchasing sufficient quantities of lenacapavir doses to protect 3 million people from the risk of HIV, working with drone delivery company Zipline to support medical supply delivery to 15,000 health facilities across Africa and purchasing 30 million spatial mosquito repellents to reduce malaria risk. Some of these interventions seem promising; lenacapavir, in particular, might be able to reduce the risk of HIV spread due to other aid cuts. But these programs are relatively small in comparison to the cuts; in the hundreds of millions of dollars rather than billions.

Furthermore, the State Department lacks the kind of evaluation capacity that could monitor impact at scale and determine if drone delivery is cost-effective or how spatial mosquito repellents function in situ. It is likely we won’t know if these programs are more or less effective than the USAID programs they replaced.

Finally, the administration has taken perhaps the most politically robust and least efficient part of U.S. foreign assistance — defaulting to U.S. food delivered on U.S. ships even in emergency contexts — and made it even less effective. The program is now located within the Department of Agriculture and is seemingly focused on maximizing purchases from American farmers and seeking to build markets rather than minimizing global hunger and sending food to countries that aren’t in dire need of support.4

Secretary of State Marco Rubio has sought to wield aid more deliberately as an instrument of U.S. foreign policy, prioritizing strategic investments that advance U.S. geopolitical and commercial objectives, while also keen to proclaim America’s continuing generosity and innovation through global health support and humanitarian relief. The administration still echoes its early criticisms of prior foreign aid, signaling plans to move away from many of the NGO implementing partners of the past. But realizing a new vision around an expressed desire to ensure accountability, work more directly with partner governments and foster novel solutions could run headlong into capacity constraints — and may fall short of lawmakers’ expectations for what U.S. foreign assistance should look like.

Congress Begs To Differ

Over the last year and a half, lawmakers on Capitol Hill demonstrated limited appetite to save the institution of USAID — and where some did push back, they lacked the votes or political capital to stop its dismantling. Alongside bipartisan concern with the level of bureaucracy that had accreted at the agency, and justified concern that some USAID-funded programs were not evidence-based or cost-effective, many Republican lawmakers came to see USAID as a wasteful bastion of liberal ideology.5

But criticism of USAID does not mean that there is no appetite for foreign aid. In fact there is an abiding bipartisan desire to preserve some of the scale and breadth of activities that USAID previously managed. The spending deal reached by Congress in January preserved considerable funding for global health, humanitarian and economic assistance accounts.6 Congress also does not appear to agree with the Trump administration’s far narrower list of priorities; that package and the draft FY27 House spending bill include directives for spending in areas including agriculture, education, water and sanitation, democracy promotion, violence against women and women’s empowerment — all areas the administration’s actions suggested it was ready to abandon.

What happens to this funding remains an open question, given the administration’s limited capacity to spend it (and, at least in some quarters, a lack of will to do so). Last year, the administration managed to recover nearly $13 billion in previously appropriated funding for foreign assistance.7

But while the White House hasn’t ruled out the prospect of rescinding additional funds, administration opposition to foreign aid spending in general appears to be softening, at least somewhat. In fact, its most recent foreign assistance request to Congress was for additional (supplemental) funding: $1.4 billion in health and humanitarian support to respond to the Ebola outbreak in DR Congo and Uganda.

Where Do We Go From Here?

The State Department lacks the capacity to allocate the money currently proposed for foreign aid in the way it has been allocated in recent decades. The question, then, is what is an appropriate architecture to allocate funds (if indeed, they will be allocated at all).

Ideas include bolstering State Department capacity in global health and humanitarian delivery and making more use of other agencies that survived thanks to continued bipartisan support. These include the Millennium Challenge Corporation (which works with recipient governments to finance a package of investments designed to promote economic growth) and the U.S. International Development Finance Corporation (which invests in private sector projects mostly in developing countries). Another option is creating a new development-focused agency. None seems to be a clear winner at this point; at the moment, U.S. foreign aid still operates in a state of limbo.

Almost 18 months on from the foreign aid “pause,” the U.S. government has lost much of its standing capacity to respond to global health and humanitarian threats, to pilot and evaluate new approaches to development challenges and to deliver programs from peacebuilding through education to democracy promotion. Many lives have been lost, and the reputation of the U.S. as a reliable development partner has been undermined.

There is still the hope that a bipartisan coalition can come together not only to protect funding levels but to create new institutional structures for foreign assistance that, in the best of worlds, deploys that funding with greater impact than ever. But the shape, scale and extent of any replacement — if one emerges at all — is yet to be seen.

Charles Kenny is a Senior Fellow at the Center for Global Development, and the author of Getting Better: Why Global Development is Succeeding and Life, Liberty, and the Pursuit of Utility: Happiness in Philosophical and Economic Thought. Erin Collinson is director of the US Development Policy Program and a senior fellow at CGD. She previously served as director of policy outreach. Prior to joining the CGD staff, she spent over five years working in the US Senate.

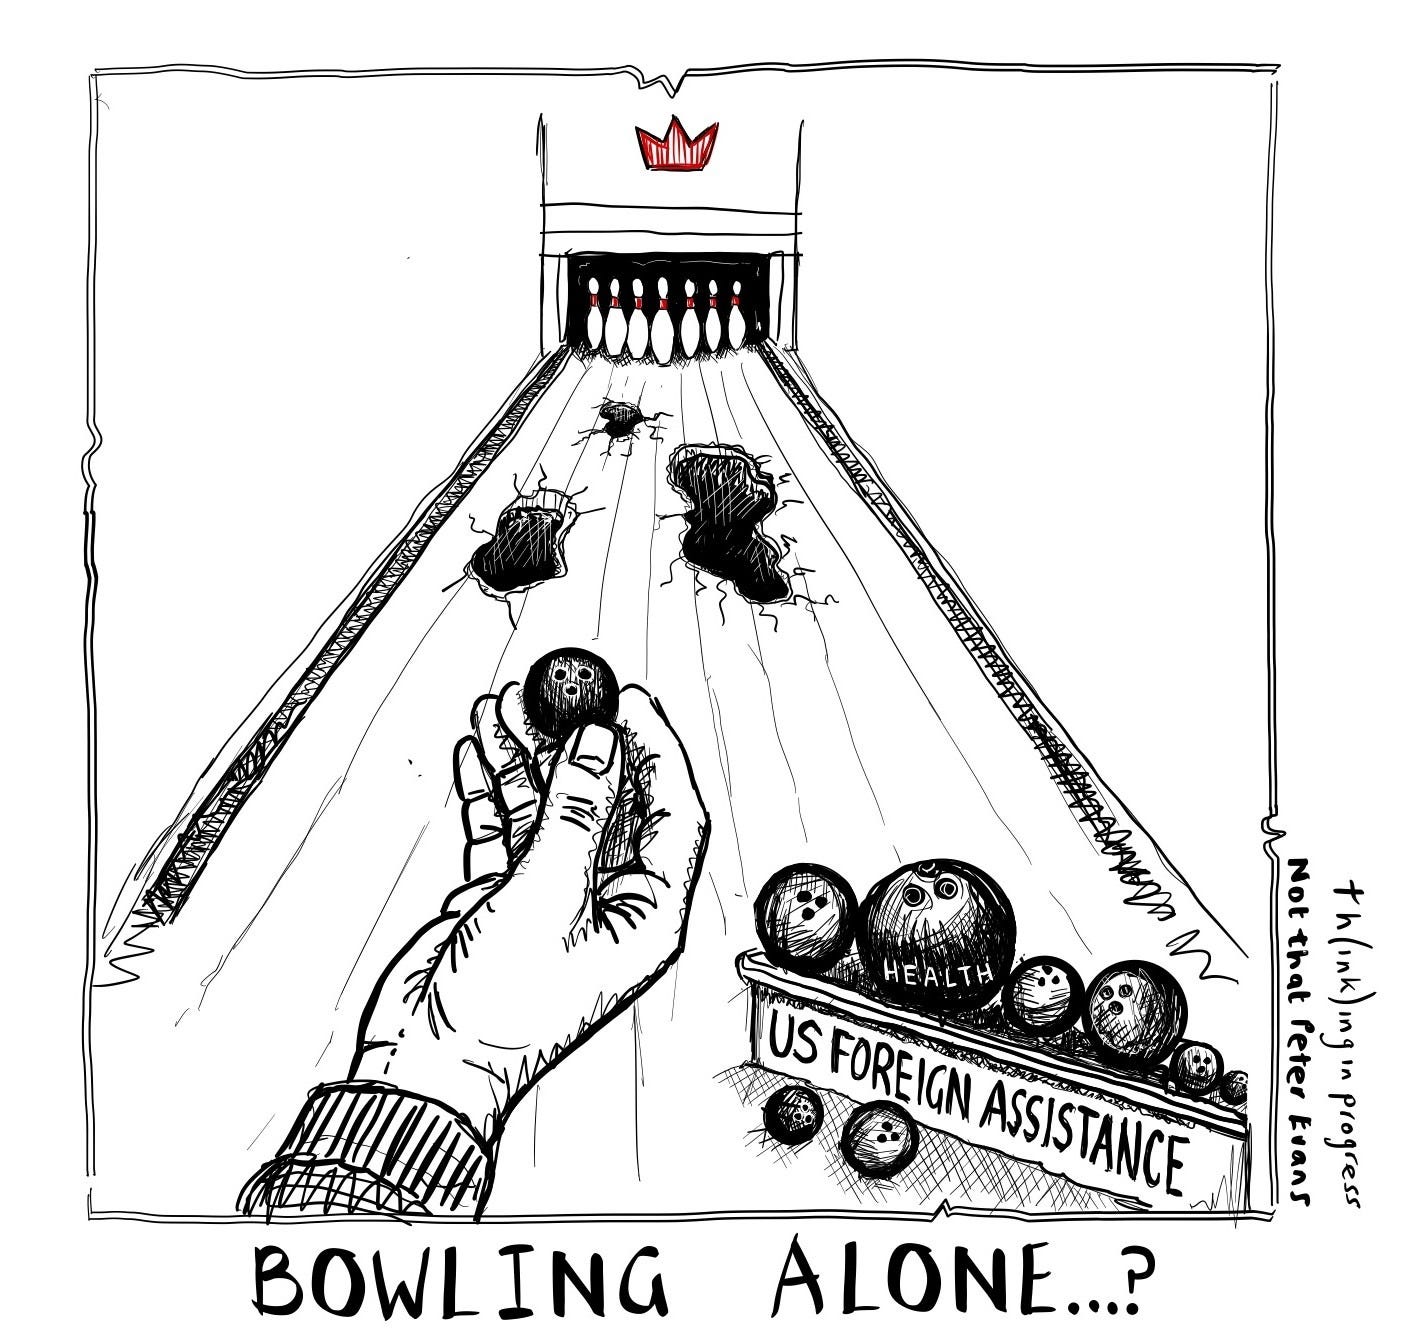
cartoon showing a person bowling in a bowling alley with holes that the balls may fall into

If you have comments on this article, or wish to contribute to the discussion, please email them to letters@indevelopmentmag.com. Responses will be featured in a letters section.

  1. Total foreign assistance is measured as the 151 International Development and Humanitarian Assistance account. This excludes Economic Support Fund humanitarian and development assistance (notably to Ukraine). ↩︎
  2. Numbers pulled from USAspending.gov in early August 2026; it is possible later revisions will change these slightly. ↩︎
  3. A recent announcement suggests the State Department will pursue health and humanitarian aims through funding directed through a growing network of faith-based organizations, but it is as yet unclear how much of that funding would be new money vs. redirected current obligations. ↩︎
  4. Such as Rwanda and El Salvador. ↩︎
  5. The skew of political donations by staff did give some credence to that second allegation. ↩︎
  6. Across several major foreign assistance accounts, FY24 and FY25 non-emergency appropriations was $20.6 billion, with FY26 coming in at $23.1 billion. ↩︎
  7. State also notified the Hill in April that they are holding $19 billion across several accounts for USAID “close-out costs.” Since it is unlikely that closeout costs will reach $19 billion, it is unknown what these funds will be used for. ↩︎

In 1993, I was sitting on a mud floor with a small group of women in a village in Karnataka, trying to start a conversation about their lives.

I had a survey for them to answer: heavy on questions that required numerical answers about consumption and family structure — who lived in the household, how old they were, what they had eaten, what the roof was made of. This is standard stuff in development economics.

We were a few minutes in when the door slammed open. One woman’s husband stormed into the room, grabbed her by the hair and dragged her out, shouting that lunch wasn’t cooked and she was wasting her time with us.

I was a young economist then, with a freshly minted PhD. My questionnaire had no item for what I had just seen. We had not come to study domestic violence; we had come to collect evidence on more prosaic questions of how sociocultural and economic systems shape marriage markets and living standards.

This is a vague enough remit that, in principle, almost anything should have qualified as relevant; it should have been easy to retool and collect more data that accurately reflected women’s lives. But the survey we had brought with us — with all its inherent assumptions — was calibrated to register what could be measured cleanly and not much else. Our disciplinary training was not fit for purpose.

It took us a week of staying in that village, drinking buttermilk and coffee, sitting through many silences, before one of the women finally opened up and said: “You have become our friends and we can’t lie to you anymore. We feel like we are in jail. Our husbands beat us all the time. They spend the family money on alcohol. No one helps.” 

That was new information. We rewrote our questionnaire on the spot, added items on wife-beating, which resulted in a mixed-methods analysis of domestic violence and one of the first economics papers on the subject in a developing country.

Photo of Rao with villagers
Vijayendra Rao (in blue shirt) with team in rural Karnataka, 1993. © Vijayendra Rao

I have thought about that week for more than 30 years. Not because the story is unusual — anyone who has done serious fieldwork has a version of it — but because of what it taught me about my own discipline. I am an economist, and economics is well known for its rigor, its emphasis on quantitative methods — and its distance from its subjects. Economics tends to focus on the measurable, which can exclude what is important; if it cannot be included in a survey module, it is not worth studying. But life is about more than survey modules, and the wall between economist and subject is not a methodological convenience. It is the central problem with the discipline.

I have spent my career as a kind of spy — an economist smuggling anthropology’s methods across the wall. I have written the careful academic version of this argument. What follows is the version I would talk about over a drink.

How We Got Here

Things did not start this way. In the late 19th century, Charles Booth, a shipping magnate turned amateur sociologist, took it upon himself to find out how the poor of London actually lived. He spent 17 years on the job. His team gathered information on 4 million Londoners: school inspectors, factory owners, clergymen, policemen and many more. They did surveys, but they also did much more: they took notes, they did open-ended interviews, they made color-coded maps. Booth used both numbers and stories because his question — what does poverty look like in London? — demanded both. He and his team stitched all of it into 17 volumes of “Life and Labour of the People in London,” showing, block by block, who was wealthy and who was destitute and who was somewhere in between. This integration of both story and data shaped economic and social policy in Britain for a generation.

Over the 20th century, that integration came apart. Economics, in its push for scientific status, narrowed itself to the analysis of quantitative data. Cultural anthropology split off into the ethnographic tradition — some of it deeply insightful, and some of it consumed by critique and navel-gazing. Sociology fragmented into many parts and a spiral of internal arguments over methods. Psychology went experimental. Political science was increasingly influenced by economics both in theory and method but retained an openness towards mixing qualitative and quantitative methods. By the 1980s, the disciplines distinguished themselves from one another mainly by what they refused to look at.

In economics, there were a few attempts to bridge this gap that did not have much of an impact. Back in 1984, Pranab Bardhan organized a seminal conference on “Conversations Between Economists and Anthropologists” on data and mixed methods. In 2002, I tried to make a case for “participatory econometrics.”

Then came the credibility revolution. In an effort to make research more credible and reliable, causal inference became the lodestar of empirical economics.  This meant that economists could say with confidence that A caused B, but it also meant neglecting the types of questions that could not be answered with these tools.

I do not want to be misread. The credibility revolution is a major leap forward for the social sciences. We can now answer questions that were genuinely beyond us 30 years ago. But when the only acceptable tool is a hammer, one tends to look for questions that could use a nail. Economists tend to prefer questions that can be answered cleanly and leave aside those that cannot. In development, the consequences have been particularly stark. We can now estimate to three decimal places how a cash transfer affects a child’s height. We have almost nothing to say about how the program worked (or did not work) and we almost never hear directly from the child and their family about what they had to say about it — in their own words.

The Distance Problem

In 2002, the sociologist Michael Burawoy drew a hard line between what he called positive science and reflexive science. Positive science — which is roughly economics — insulates itself from its subjects. Data collection is standardized so it does not matter who is collecting the data. The researcher does not have to be on site; a survey firm can administer a survey as well as s/he can. The world is to be observed, not participated in. Reflexive science — ethnography, in its best form — embraces the opposite point of view. The interview is not separate from the intervention; it is part of it. The researcher is not separate from the research; rather, her presence is a key part of the process.

Burawoy thought these two ways of doing social science were so different that they could never be reconciled. I disagree, and I have spent much of my career trying to marry the twain that he argues could never meet. But he is right about one thing. The distance between researcher and researched is real, and in development economics it is stark.    

Almost everyone I know who studies poverty has never been poor. We are often from different countries, different social classes, different castes and races, often speaking different languages, from the people we write about. None of that disqualifies you from working on poverty — it would be a strange profession that insisted only the poor could study poverty — but it should give us some humility. Most development economists do not know what the lives of poor people are actually like, day in and day out.

What the discipline rewards instead is a performance of objectivity: Researchers should not influence their subjects; they should stay at arm’s length and use the same tools as everyone else. Your subjective suspicions should not contaminate your analysis. You are not a part of the subject group, and you should not be; your influence upon them would make your research less valid. 

In short: the more distance we have from those we study, the more clearly we will see them. The opposite is closer to the truth. Distance does not produce clarity; it produces the kind of clarity you get from squinting through a small circle that you have cleaned inside a dirty window. It convinces you that what you can make out from where you are standing is all there is to see.

Four Things We Could Actually Do

So what would it take? I suggest four things economics (development or otherwise) could do to limit researchers’ distance from their subjects. 

Cognitive Empathy

The sociologist Mario Small uses the phrase “cognitive empathy” to mean the ability to understand a person’s predicament as they understand it. It does not suffice to think about how you would feel if you were in their position;  you must think about it as they understand it from theirs. It is much harder than it sounds. It requires you to take seriously the possibility that your subjects’ theory of their own lives is more accurate than yours.

Some of the best development economists I know have this in spades. Jean Drèze has lived for decades in the rural India he writes about, refused funding from institutions like the World Bank that he thought would compromise his independence and successfully pushed for one of the largest rural employment guarantees in the world. Despite this, he almost never publishes qualitative analysis; his work is overwhelmingly quantitative. But every sentence is shaped by years of having actually listened. He is not alone among economists; Christopher Bliss and Nicholas Stern spent eight months in the village of Palanpur in the mid-1970s and inspired what is now a multigenerational research project.

The point is not that empathy must show up as a qualitative paragraph in the paper. Merely having done a focus group that you report in a footnote for color (and to signal your field creds) is not enough. Many economists already do this; it clearly isn’t sufficient to reduce the distance between the researcher and the researched.

It is that the work has to be shaped by it. And here is the awkward truth: Almost all of contemporary development economics is not. We design experiments based on the input of other economists. We read papers, we deliberate in seminars, we come up with new models based on economic theory rather than experience. The intervention happens through an implementing partner, and the endline survey through a survey firm. Even the analysis might be handled by a research assistant (or, now, coding agent). The result is a body of work that is technically immaculate and substantively thin. To paraphrase an old chestnut: It is an expensive way to be precisely trivial rather than vaguely right.

Narratives Are Data

People do not talk in numbers. They talk in words. They tell stories, they contradict themselves, change the subject and circle back. They forget things and remember them halfway through the next topic; they get distracted and tell you about something interesting but unrelated. Survey instruments are a kind of violence against this — useful violence, often, but violence nonetheless. Instead of the messiness of human life, you get a small number of tick boxes.  If the boxes are well designed, you get a lot of information. But you never get everything, and frequently, you will miss the most important parts.

The book “Portfolios of the Poor” is what every economist should be made to read on this point. The authors — a development economist (Jonathan Morduch), an anthropologist, a microfinance practitioner and a finance expert — gave up on standard surveys and instead visited 250 households in Bangladesh, South Africa and India at least twice a month for a year, building “financial diaries” out of long, open-ended conversations. They estimated that one-shot surveys were missing about half the financial activity of a poor household. Half. The poor were not, it turned out, simply consumption smoothing. They were trying to manage portfolios of assets under conditions of grotesque uncertainty, with very little room for error. No standard consumption survey would have shown the level of complexity in how the poor managed their households; researchers had to let households describe their finances in their own words.

I have done versions of this myself. With Paromita Sanyal, I spent 10 years analyzing transcripts of 300 village meetings in South India — what we called “oral democracy” — to understand whether poor, low-literacy, deeply unequal communities could actually deliberate in any meaningful sense. (Spoiler: They can, and the quality of that deliberation depends much more on state government policy than on the village’s literacy rate.) 

Ten years is a long time. It is also why so few economists do this kind of work. Tenure evaluation is often slower than that; investing in something that might not bear fruit until after tenure is a difficult choice for many early-career faculty. Worse yet, this kind of data does not always lead to the kind of publication that gets you tenure. My work was eventually published as a book, not a top-five journal article — a much lower-value thing when one is up for tenure. 

And until very recently, the technology to scale up the analysis of narrative data simply did not exist. The 10 years were a function of the technology of the time, not a requirement of the method. With today’s technology — recording devices, AI for transcription — collecting qualitative data is easier than ever. Embedding a few weeks of open-ended interviews in a standard RCT, reading the transcripts your survey firm’s enumerators could be collecting anyway, piggybacking on existing qualitative data — these fit inside a dissertation timeline, and the tools for scaling them are getting cheaper every year. 

The deeper point is the disciplinary reflex. Open-ended narrative is still routinely treated in economics as “anecdote” rather than data. Researchers who mix quantitative and qualitative methods are, to quote the political scientist Atul Kohli’s wonderfully insightful joke, “stuck between a rock and a soft place.” Reviewers reject them because of a perceived lack of rigor, and editors do not see the added value. 

I have had this happen to me directly. The two early papers on domestic violence I mentioned earlier — one using a combination of ethnographic and econometric methods, the other building a game-theoretic model of dowry violence and testing it with survey data — were originally a single paper. When I included qualitative methods in the paper, it was rejected from several economics journals. My co-author Francis Bloch and I gave up and split it in two — one of the resulting papers was accepted into one of the most prestigious journals in economics.

This distaste for the qualitative is one of the stranger superstitions in the discipline; there is no methodological reason a transcript is less informative than a Likert scale.

Take Process Seriously

Empirical economics, especially since the credibility revolution, has become almost monomaniacally focused on outcomes. Did the intervention work? By how much? For whom? These are good questions, but they are not the only ones. It is rare for empirical economics papers to spend much time focusing on how an outcome happened. Who said what to whom to start the process of change? Who were the early adopters, and who had to be brought along later? What did people think about the intervention? An RCT can tell you if an intervention worked; ethnography can tell you why. Mechanisms often get short shrift in empirical economics. You do your RCT, you get your result, you come up with some plausible explanations, you write up a model for how those explanations would work (if they’re right). This is fine as far as it goes, but it does not go very far.

The map of mechanisms you can construct from theory alone is a small subset of the mechanisms that actually operate in the world, and reasoning from outcomes back to mechanisms is a notoriously unreliable exercise. The alternative is to actually go, talk to people and observe.

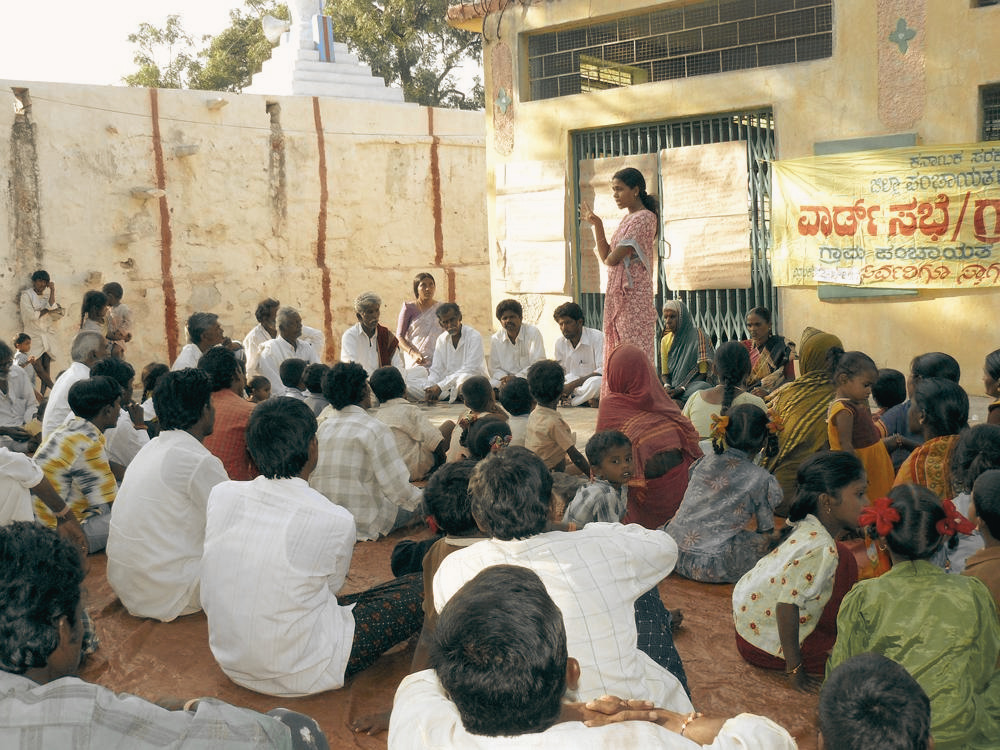
A few years ago, colleagues and I worked on a randomized trial in rural Karnataka to test whether intensive training in participatory planning would improve village governance. The intervention assigned 50 villages to the participatory training, planning and monitoring exercise and 50 to control. Instead of just relying on a baseline and endline survey (which we also did), we did the unusual thing of embedding five trained ethnographers in matched treatment-control pairs of villages for the duration of the study. They produced 240 monthly reports over four years.

villagers discussing the study questions
Participatory planning in Raichur District, Karnataka © Vijayendra Rao

The headline result was a null. The intervention did not produce statistically significant gains over the comparison villages. In the standard economics genre, that would have been the end of the story — a disappointing null. Perhaps the paper would include a theoretical model on why participation fails, but there would be very little to learn here.

But because we had the ethnographies, we could see what actually happened: The “failure” was not a failure of the idea but of the conditions under which it was tested. The quality of implementation varied a lot: Some facilitators were excellent and some were poor. Higher officials in the government did not take the intervention seriously and frequently transferred and replaced facilitators for reasons that had nothing to do with the intervention. Persistent caste-based inequality was actively chewing through any gains the training produced. The ethnography was the core of the paper, not just the color. 

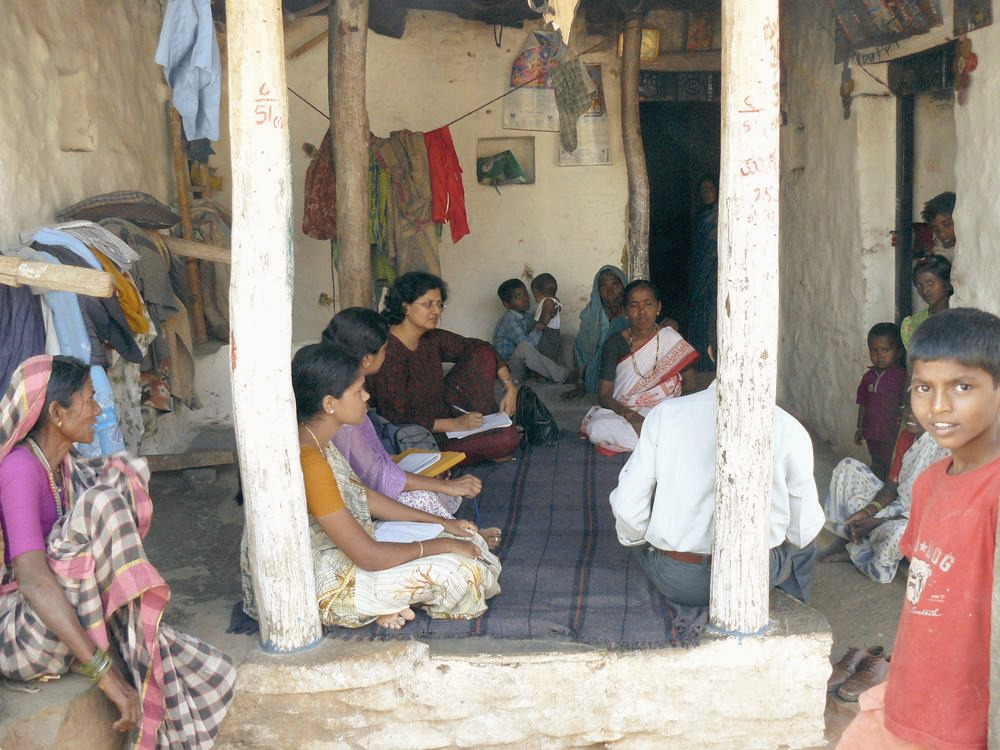
Kripa Ananthpur conducting an interview about the intervention with villagers
Kripa Ananthpur conducting an interview about the intervention. © Vijayendra Rao

Respondents as Analysts

If our purpose as researchers is to help people become better off, then the people themselves should at minimum be told what we found. Development practitioners have been talking about including those they study in the process for decades — and yet, this is rarely implemented. And reporting findings would only be step one. It would be better if they helped design what we ask. Best of all, they should be able to conduct research on their own lives without our mediation at all.

In 2014, with a group of colleagues at the World Bank, I tried this. We worked with representatives of more than 200 tribal villages in South India to co-produce a method we called participatory tracking. The villagers spent weeks deciding for themselves what counted as the good life, turned those ideas into survey questions, tested the questions in their own villages and then — using tablets and a system of video-based training — surveyed their own neighbors. In a single district, we conducted a census of 32,000 households in about six weeks. 

Only 17% of the questions overlapped with the standard Indian National Sample Survey. The villagers were asking different things because they wanted to know different things. For instance, in order to assess whether a household was poor, they devised the following question, which proved extremely effective: “Did the last person to eat in the family ever go hungry in the past week?” To a respondent this was obviously a question directed at the mother, and mothers in food-constrained households often went hungry in order to feed the adult men and children in the family. 

Literacy rates were low, so we collaborated with the villagers to produce data visualizations of the results. We iterated until people who could not read could see at a glance how their village was doing on what they cared about. The data then got used in actual village meetings. The quality of those meetings improved noticeably, because everyone was working from the same picture instead of arguing about the facts.

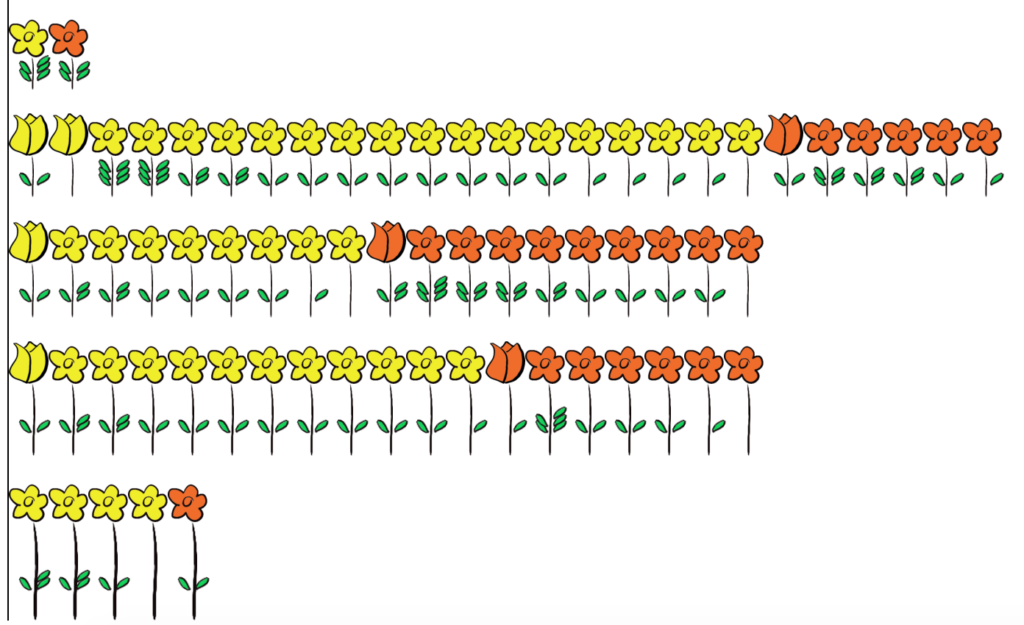
Instead of the usual LaTeX table, here is a visualization of marriage patterns that we co-produced.

Visualization of marriages in a village

Each woman in the village is represented as a flower. The height of the flower is the age at which the woman got married. The number of leaves is the number of children resulting from the marriage. A red flower indicated that the woman had married a blood relative, and a yellow one meant that she had not. A flower bud meant that the marriage was not consensual, and a bloomed flower was consensual. The mappings between the flower’s appearance and meaning were tweaked by the women to make them more relevant to their local contexts, and therefore more intuitive. 

Some villagers who saw this visualization immediately disregarded the high proportion of red flowers they saw, as marriage within families is accepted and widely practiced. However, other communities wanted to reduce the ratio of red flowers to yellow flowers by educating future generations of women about the problems related to intra-family marriage. 

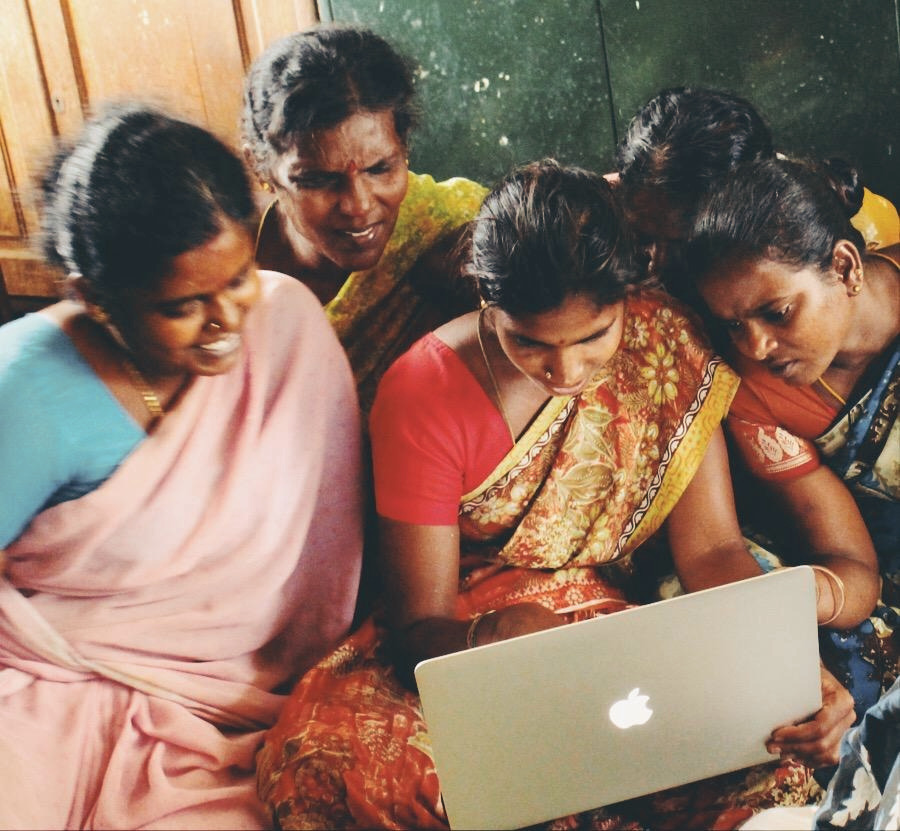
Women in Rural Tamil Nadu discussing the visualizations © Vijayendra Rao

Trust me, I know how this sounds. The rest of the field would file this experiment under “charming but unscalable.” That is a little bit true; a participatory, co-produced survey process is slower and more laborious than a standard questionnaire. We could not use a standard set of questions, because the standard set of questions wasn’t what people actually wanted to know. And the alternative was the status quo: where we would show up, ask people a bunch of questions about their lives — that they really didn’t feel were all that relevant to them anyway — and write a paper that no one surveyed would ever read. Given that, co-produced surveys seem worth the time. 

The LLM Problem

The technology for coding open-ended interview questions has also gotten much better in the last decade. Large language models are particularly adept at going through large amounts of unstructured text and pulling out themes; Claude’s current abilities would have seemed like science fiction in 2014. Now, they can essentially replace a research assistant in coding English-language text. I have used LLMs too. Some of my recent work piggybacks on a panel of Rohingya refugees and Bangladeshi hosts where we conducted long open-ended interviews with 2,000 respondents and developed a method we call iQual. It analyzed a small subsample using interpretative sociological qualitative coding and then used machine learning to scale up the codes to the full sample. This kind of project was simply not feasible before.

But using LLMs outside of Western contexts isn’t always simple. We compared our “bespoke” method to LLM-based coding and found that LLMs gave us highly biased results — possibly because they are not trained on Bengali and Rohingya dialect text. The bias of a poorly designed survey is at least legible. The bias of a frontier language model trained on the internet is not. Hopefully this is a temporary problem; with efforts in place to improve AI with under-resourced languages, LLMs will get better at this with time.

So I should be excited, and on most days I am. But I want to be careful here. It’s true that there is a version of the future in which LLMs democratize narrative analysis in the same way that calculators did for arithmetic. They are faster and cheaper and they can vastly expand who can do qualitative analysis. Unfortunately, however, I fear it is more likely that they will be used to widen the distance between researcher and respondent. If a researcher never spends time with the people they study and simply reads the LLM’s summary, there is no cognitive empathy. The LLM is the only one listening — not the researcher. My rule of thumb is that LLMs cannot substitute for a human. They can extend your reach — help you process data more quickly — but they cannot replace you. You still need to spend time in the field; you still need to talk to people about their lives and their needs. You must read the transcripts yourself; you should know the people and the context well enough to be able to tell if the LLM’s coding has gone awry. LLMs might be powerful enough to do 90% of the job — but that remaining 10% should not be automated away. Empathy is not a Claude skill.

What It Would Actually Take To Listen to Respondents

Some of this can be accomplished by individual researchers deciding to do their work differently. Quite a lot more of it requires the discipline itself to change. Right now, the professional incentives still push young scholars towards “business as usual.”

Journal editors have to stop reflexively rejecting qualitative material. Graduate programs will have to expand beyond their teaching econometrics into teaching qualitative methods as well. Hiring committees will have to start to value time spent in the field. Funders have to accept that good mixed-methods work can be expensive and slow — certainly slower than running a regression from a Cambridge office. But it will also make economics a stronger discipline. Spending time with people will produce insights that can be obtained no other way.

In the short run, I am not optimistic. Disciplines are stubborn things, and economics is more stubborn than most. It is a discipline already struggling to diversify beyond a few top programs and economics seems to be particularly prone to reproducing class hierarchies. But I am less pessimistic than I might be, because it seems things are already beginning to change.

A generation of younger development economists is more comfortable doing fieldwork than mine was. Adjacent disciplines — political science, sociology, public health — have been mixing qualitative and quantitative methods for a long time without losing their disciplinary identity.  Some of these disciplines even co-author with economists, adding depth to the rigor of an economics paper. And some funders are also starting, slowly, to ask harder questions about whose voices are represented in the work they pay for.

My argument is, fundamentally, not that complicated. If you study people, you should listen to them. This is doubly true if you study people who live lives that are very different than your own. It is on you, as the researcher, to try to close the distance between you and your subjects — building bridges instead of walls.

Thirty years ago, Robert Chambers asked an important question: “Whose reality counts?” It has still not been answered. Economics has preferred to duck the question, pretending that empirics could substitute for an answer. I do not think it should continue to do so. Indeed, I think this remains one of the most important open questions in development research.

The woman in Karnataka dragged out of our focus group by her hair was telling us something — that her reality was not captured by our questions. It took us a week to be able to hear it, and the only reason we eventually did was because we were still in the village a week later. There is no shortcut for this. 

Numbers help. So do words. But most important is sitting in the village and listening long enough, and with enough cognitive empathy, that someone tells you the truth.

Vijayendra Rao is a development economist and social scientist who combines econometric methods with ethnography. He spent 27 years as a Lead Economist in the Development Economics Research Group at the World Bank, and is currently the Roberta Buffett Distinguished Scholar-Practitioner in Residence at Northwestern University. His interests include gender, culture, participation, deliberative democracy, political economy, and innovations in mixed methods. His recent methodological work with Julian Ashwin, Monica Biradavolu, Aditya Chhabra and others uses natural language processing to analyze open-ended interviews at scale and compares it to LLM based qualitative analysis. His latest book, Revolution by Stealth: How Women’s Groups Catalyzed a Cultural Transformation in Bihar (with Shruti Majumdar and Paromita Sanyal), is forthcoming from Cambridge University Press in September 2026.

cartoon of woman with glasses with an ear instead of a lense

If you have comments on this article, or wish to contribute to the discussion, please email them to letters@indevelopmentmag.com. Responses will be featured in a letters section.

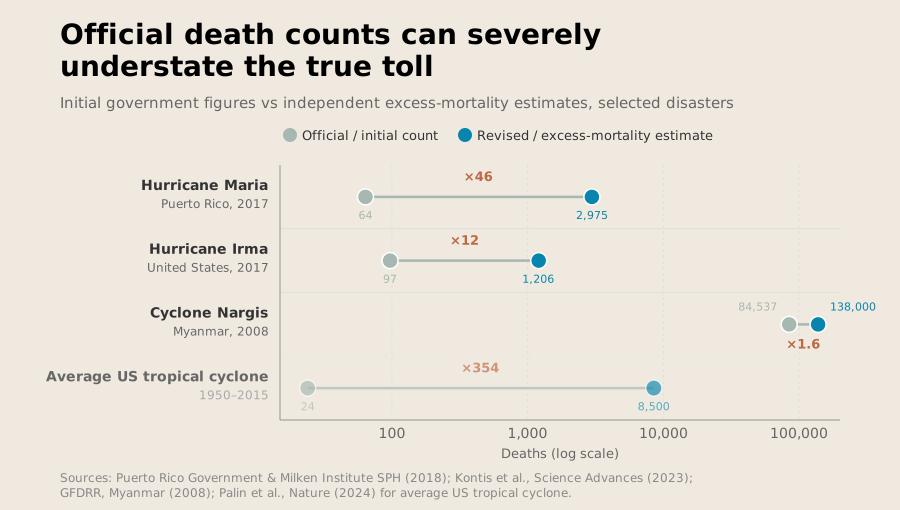
Hurricane Maria hit Puerto Rico in September 2017. In the days following the hurricane, the government reported just 64 deaths.

This number reflected only those directly killed by the hurricane — those found the next morning or soon after — and did not include the thousands who died in the weeks and months after the disaster. Maria hit the infrastructure of Puerto Rico hard: there were major power outages that shut down hospitals, medical supplies ran out and other critical infrastructure across the island collapsed. In a special assessment commissioned by the government of Puerto Rico a year later, a team of researchers revised the number of deaths after the event. The total count rose to 2,975 — 46 times higher than the original estimate. 

Satellite photo of Hurricane Maria
Hurricane Maria from satellite; image by Antti Lipponen, licensed under CC-BY.

The example of Hurricane Maria is not unique. In many countries, the databases used to track the impact of disasters can be badly wrong.

Chart showing the large differences between initial death counts and excess mortality from disasters
Across contexts, initial death counts underestimate the total death toll.

They rely mainly on government and news reports — but those are shaped by when governments choose to provide information and how these governments define what counts as disaster impact. The data isn’t just used for academic purposes; disaster figures weigh heavily in today’s world. They can influence which countries receive funding and where disaster funds are spent.

While these decisions are often framed as technical, there is a political dimension to disaster reporting. The data can often determine whose suffering is recorded and prioritized. We treat these figures as facts, but they are not. They are generated by systems, with the same fragilities as any other policy realm. Disaster data is far less reliable than its users often assume.

The criteria for good data are not controversial. Data should reflect what actually happened, capture the full picture, remain comparable across time and geography, and not count the same event twice. Unfortunately, we are far from achieving that. 

How Disaster Databases Actually Work

We need data from disasters. Recovery efforts must be planned, humanitarian assistance delivered and resilience plans made. The Emergency Events Database (EM-DAT) is the most widely used free source of global disaster data, covering both technological and natural hazards. It has records of more than 27,000 events since 1900. For an event to be included, it must meet at least one of three main criteria: 10 or more people killed; 100 or more people affected; or a declaration of a state of emergency or call for international assistance. 

While reasonable, these criteria mean the dataset has blind spots. A drought that killed nine people will typically not be included in the database, unless it triggers an emergency declaration or an international call for aid. The same occurs for a flood that affects 95 people. And there’s an important caveat there: it is focused on the number of people reported affected or killed. If the reporting isn’t accurate, neither is the database. EM-DAT requires cross-verification of each event from at least two independent sources, which are often international agencies, wire services and English-language media.

Given this, geographical bias in media reporting is likely to propagate into the EM-DAT database itself, leading it to capture more disaster events in developed economies than in less developed ones. It also lets governments manipulate the data. If the government only admits to nine deaths, the event won’t be included — even if there are far more than nine deaths in reality. This lets governments evade accountability for their actions.

Consider the 2008 Sichuan earthquake in China. Several of the hardest-hit areas were poorer counties in the region, and many buildings collapsed. The official death count was fixed at around 70,000, with a further 18,000 people still listed as missing. Parents, activists and journalists who tried to seek accountability and investigate construction codes and the collapse of buildings were targets of censorship, detention and surveillance; the full toll and responsibility, especially for the school collapses, remain difficult to verify independently. 

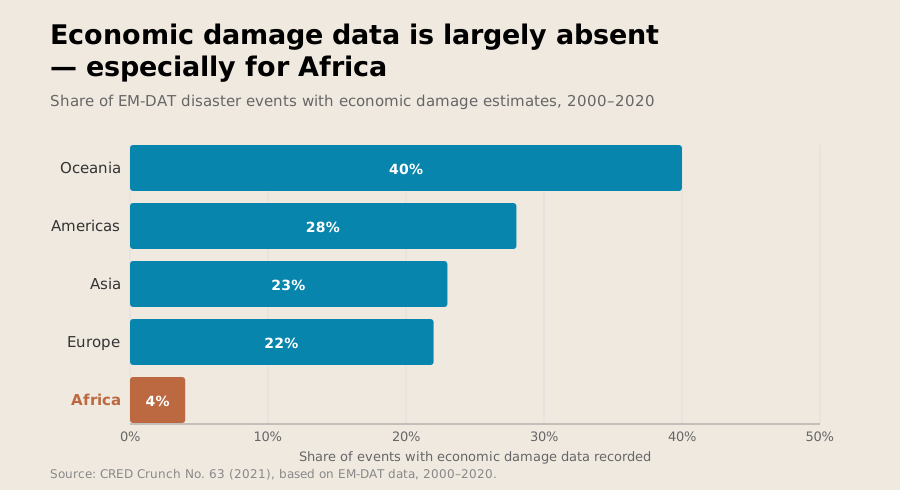
Even when an event meets the thresholds, other information may be incomplete. Information on economic losses is the main source of missingness; it is unavailable for 80% of the events recorded from 2000 to 2020. Economic damages are hard to calculate and are rarely provided in low- and middle-income countries. Just 4% of African disasters recorded in EM-DAT have economic damage estimates.

Chart showing how few disasters have economic damage estimates
While no region has complete coverage of economic damages, Africa has particularly bad coverage.

But this doesn’t stop people from using the data off-the-shelf. A growing number of highly influential and widely cited publications use this data for empirical studies with very limited acknowledgement of its problems.

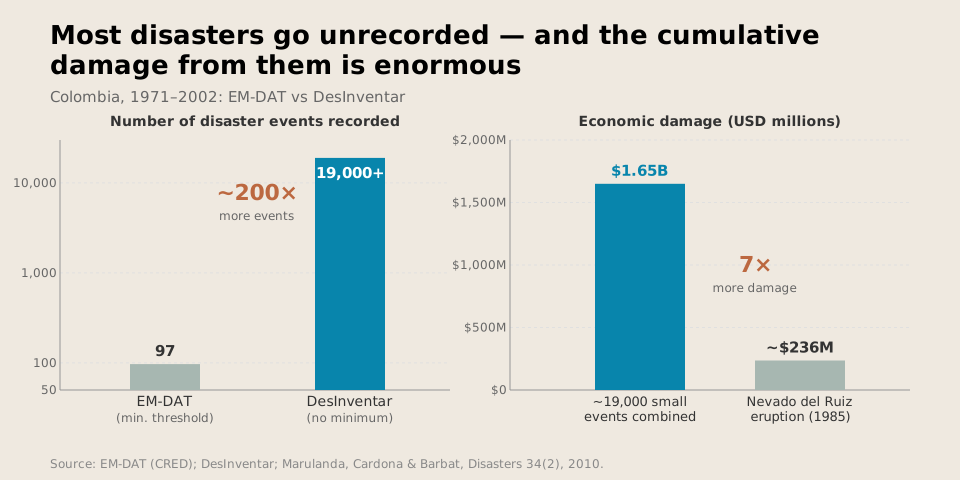
The scale of the limitations becomes clearer when you compare disaster databases. Between 1971 and 2002, EM-DAT recorded 97 disasters in Colombia. Another database, DesInventar, recorded more than 19,000 in the same period. Only a small percentage of the local events in DesInventar would meet EM-DAT’s definition of a disaster, but taken together, the “small” events in Colombia caused more than $1.65 billion in damages. This is around seven times the economic losses caused by one of Colombia’s deadliest disasters, the Nevado del Ruiz volcanic eruption. Together, these “small” events pack a big punch.

Chart showing small disasters combine to have more impact than large disasters
There are many small disasters; together, they cause as much damage as large events.

DesInventar represents a different type of disaster database. Instead of setting specific criteria for inclusion, DesInventar allows countries to freely build their own disaster inventories. In general, this means that it includes smaller disaster events, but it also means the quality of the data included within the database depends on each government’s capacity to collect and maintain records. This can vary considerably. Peru is a prime example. Its data uses a single source — and events near Lima are far better covered than events in more remote parts of the country. 

Nor is that the only discrepancy. The count of those who are “affected” can vary substantially. EM-DAT defines those affected as requiring immediate assistance, but countries have different standards for what is considered “assistance.” Some include all those in the disaster zone; others include only those who lost housing, while still others count assistance requests as the parameter. Countries might even strategically choose who counts as affected, because such data can help determine if a country qualifies for climate adaptation financing or not.

Other categories of data are even murkier. As noted, economic damage estimates are often missing and where they do exist, the data is sketchy at best. Some studies comparing disaster events between EM-DAT and DesInventar found that damage figures diverged by more than 20% in most cases.

Turning Disaster Data Into Policy

This may seem an academic concern. It is not. These databases are used in real policy decisions.

The United Nations Office for Disaster Risk Reduction uses both EM-DAT and DesInventar for its Global Assessment Reports, one of the main publications guiding international disaster policy. United Nations Member States also report their progress through the Sendai Framework Monitor, which uses disaster databases as inputs. This is then used to track progress, identify disaster-risk priorities, guide resource allocation toward risk reduction and help plan climate adaptation strategies.

Climate finance, a sector that moved $1.9 trillion in 2023 alone, also uses disaster databases to assess climate-related disaster risk. Countries often use Germanwatch’s Global Climate Risk Index to discuss the need for funding support for adaptation or losses. Germanwatch’s current index uses EM-DAT with a few caveats on its limitations. This loss and damage analysis, for instance, uses the index without discussing its data limitations.

The reliance on EM-DAT goes beyond the Global Climate Risk Index and into the operational structures that determine humanitarian funding flows. The INFORM Risk Index uses EM-DAT for a few of its hazard indicators and has been used by the United Nations Office for the Coordination of Humanitarian Affairs, the European Commission’s Civil Protection and Humanitarian Aid Operations, the World Food Programme, the United States Agency for International Development, the UN Central Emergency Response Fund and more to help prioritize and allocate humanitarian resources. Mistakes in EM-DAT could leave disasters underfunded. This might occur if many more people died than are reported in EM-DAT because their deaths were not reported in English.

In 2015, the Malawi government paid $5 million for drought insurance through the African Risk Capacity (ARC), which pays out when its model estimates that a drought has crossed a given threshold. After the 2016 El Niño drought, which left 6.5 million people in need of aid, the model initially found that no payout was warranted, based on a false assumption regarding the maize variety farmers had planted. A payout was made in 2017, by which point the response had cost around $395 million. 

Building Firmer Ground: Five Fixes


We clearly need disaster data. Without databases like EM-DAT and DesInventar, we would not be able to understand and respond to disasters. It would be far more difficult to respond to climate change and plan adaptation strategies to prevent future disasters. But they are far from perfect.

Improvement is possible, though. Indeed, as the world warms, and climate-related disasters become more frequent, improvement is necessary.

First: we must begin to treat disaster databases not as a single source of truth but as part of a system. Each disaster database is a measurement tool with reported limitations, but considering them together can limit the errors. Resource allocation should be triangulated between different disaster databases and local disaster inventories. This will help limit missing data — especially vital given that smaller, recurring events represent an important share of the disaster impact.

Secondly, disaster impact should be reported in ranges, not in a headline figure alone. It is too easy for policymakers to focus on a single number without taking into account the uncertainty behind it. In 2015, the Integrated Research on Disaster Risk program recommended that disaster data should include reliability information such as a quality score or uncertainty level. Initially reported mortality figures from Hurricane Maria were 46 times lower than those produced by the excess mortality analysis. A reporting range would not have eliminated the discrepancy, but it would signal to policymakers that the number was provisional rather than definitive. 

Third, we must verify official counts independently. Governments are not always incentivized to tell the truth, and even if they are attempting to do so, different standards can lead to vastly different estimates of damage. Instead of relying on a count of people in a damaged area, we should focus on excess mortality as a standard post-disaster metric. This would provide an independent data point against which official figures can be assessed; if a government gives a figure that is many times less than the number of excess deaths, they can be called to account.

We can also use satellite imagery to validate data. This was used to great effect after the Haiti earthquake in 2010, as well as in Turkey after the 2023 earthquakes. These technologies cannot replace ground-level data collection, as they cannot count individual people. However, they provide a form of independent analysis that can be used to compare against other figures that enter disaster databases. This is particularly useful in contexts with weak data collection or reporting infrastructures; in countries like Haiti, it can be nearly impossible to collect data door-to-door.

The fourth fix goes hand in hand with this. We must also better fund local data systems. Several countries have adopted DesInventar-based systems for their own disaster loss accounting, but there are few incentives for maintaining these systems. Every year, governments need to train personnel, validate data and verify that interconnected systems actually function together. Each of these costs money, and none happens automatically; international organizations should help support this where possible.

Fifth, make the limitations of the data visible. No policy document should use disaster data without caveats. Each disaster database comes with its own biases; none is perfect. Without caveats, policymakers may take the data off-the-shelf without considering those biases. Every report that cites disaster data should include material like SDG monitoring metadata, INFORM’s reliability score and Climate Analytics’ loss and damage briefing to provide the reader with context about the data reliability.

No system is perfect, and the systems built to account for the impacts of disasters, including who was affected, the size of the human losses and the economic cost, will always carry intrinsic assumptions, political pressures and institutional limitations. But we can do better than the current system, particularly as natural disaster frequency increases due to climate change. Preventable mistakes will come with a death toll, and right now, disaster databases risk mistaking what is currently reported for what matters. 

Matheus de Souza is a PhD student in Disaster Science and Management at the University of Delaware and has worked with different humanitarian organizations such as the United Nations High Commissioner for Refugees and the Norwegian Refugee Council. He studies several aspects of disasters, with a focus on inter-organization coordination.

Cartoon of people saying "their data is the real disaster"

If you have comments on this article, or wish to contribute to the discussion, please email them to letters@indevelopmentmag.com. Responses will be featured in a letters section.

It was the sort of puzzle that you don’t notice at first. It was Juba, South Sudan, in 2012; a place where and time when, frankly, problems were not hard to find. The perhaps surprising absence of a problem was easy to overlook.

I was there helping the government think about the management of its pooled fund — the primary structure via which donors put some funds under some small measure of government control — and working to expand its agency where possible, rather than letting the desires of donor organizations and their representatives be the driving force. Whenever I asked for data to help us better understand context, it was there. It also hung together into a coherent picture — at first pass, at least, it seemed accurate. People trusted the data they got; donors, government, NGOs seemed to report government data to me without the subtext of an eye roll indicating “who knows if this is at all accurate … but here’s what we have.”

This was unusual; when I had worked in other developing countries, the prevailing view was often that the numbers just couldn’t be trusted. No one thought the data in South Sudan was perfect, of course, but it was remarkably reliable for a newly independent country the size of France with the population density of Sweden.

Why Do Some Things Work Surprisingly Well?

This puzzle stayed with me; if it was a mystery novel, it might have been “the curious case of the excellent data.” Some years later I was researching the importance of mission-driven public servants when I asked Fiona Davies for her recommendations of the most impressive, mission-motivated leaders she’d come across in her wanderings through the world.1 Her answer was one name: Labanya Margaret, the longtime director general of the National Bureau of Statistics in South Sudan.2 When I found her, I had found the answer to my puzzle.

Margaret is a true believer in the power of statistics – and one who conveyed that passion, that sense of importance, to her staff. She says that “the data is not for the Bureau of Statistics. It is the voice of the voiceless. The population is the ones saying they did not eat. … The health data says women are dying while delivering.” 

As Margaret put it – speaking in the reverent and awestruck tone many reserve for prayer — “Numbers change people’s lives.” For Margaret, good data allows better decision-making – with accuracy key to generating those welfare impacts. 

Building up the National Bureau of Statistics in her new nation was no small feat. The country had no baseline data – almost all information was being collected for the very first time. It is hard to imagine a more difficult environment for monitoring performance, and thus for a management strategy focused on ensuring compliance – how could Labanya know if her staff had collected accurate data, if there was nothing to compare it to? 

Labanya’s supervisors empowered her to exercise judgment and implement the solutions she thought were most effective. She in turn worked to create a sense of shared mission and collective commitment. Labanya was “loving and respecting” of her staff. She focused on making sure she could “understand the interest of (her) team.” She wanted to “generate and connect with them. Allow them to explain their position to (her).” She remembers, “Whenever we went to the field, I made sure to place (the staff in my mind), to connect the face to the place where I saw him or her.” 

Margaret placed great emphasis on living up to her commitments to staff – something that is not always the case in places where employees have little recourse for mistreatment. “When you say you will pay them, you have to pay them on time: ‘We will pay you, and we’re going to pay you $10. It’s $10, not less.’” 

And it wasn’t just about the staff. Labanya saw data collection as a joint effort between the many members of her team and the population participating in the survey: “Whatever we had done was not our effort but the effort of a collective team and also their own, the people from whom we collected this information, so we constantly went back to thank them and to really recognize their contribution.” “The numbers are telling exactly what (the people) are going through: the pain they are suffering, the joy and their future visions.” 

The result? Data that was extremely high quality. In a context where nothing could be taken for granted — where one couldn’t even rely on the water — they had sent out enumerators to interview the population and bring back information, and it had worked! You need not take my word for it; a Harvard Kennedy School paper describes one of the bureau’s key initiatives, an innovative high frequency household survey, as having “achieved rapid success.”3 World Bank researchers described the survey as innovative and highly reliable – a model for how to collect data in difficult contexts.4

Lots of Stuff Works Pretty Well When You Might Not Expect It – and When It Does, It Reminds Us That Every What Problem Is a Who Problem

Not every agency or every task has the blessing of a Margaret trying to make it work well on behalf of the state. But there is nonetheless a very real sense in which Margaret is typical, not exceptional.

For all the things not working in the world, there are many that do – and where they do, you very frequently find excellent managers who care about the mission and empower their staff in ways that encourage them to feel similarly. Sociologist Erin McDonnell finds excellent mission-motivated bureaucrats who are critical to the capacity of high-performing sections of multiple public organizations in Ghana as well as in Nigeria, Kenya, Brazil, and China.5 Political scientist Merilee Grindle found nearly 30 years ago that management style and (high) performance expectations were key to the cultures of organizations that perform well in a study of 29 organizations across six countries. 6

In contrast, monitoring and control — the workhorse “technology” for trying to improve implementation — very often doesn’t work. A series of carefully identified empirical studies show that an approach based on controlling your employees very frequently undermines performance – and does so even more as tasks become harder to monitor. 7

The difference in management can make a large difference. In one illustrative example, a group of economists found that moving the individuals and organizations at the 25th percentile of effectiveness in Russian public procurement to the 75th percentile would result in 13.9% in savings; this represents about $10 billion a year in potential savings.8

One management aphorism goes “Every what problem is a who problem.” Coined (or at least codified) in a business book by Ben Horowitz, cofounder of mega-successful venture firm Andreessen Horowitz, it is meant to remind the (largely private sector, and in particular technology-focused) readership that it is natural and easy to think of capacity challenges as technical in nature.9 That isn’t true, though, as the evidence shows; capacity challenges are almost always about people, and the environments in which those people are placed.

It’s Not About the Individual; It’s About the Team

One possible way of taking the insight that it all boils down to people would be to try to just figure out who the good ones are and have them do the work. Let’s hire those 75th-percentile procurement agents and fire the 25th-percentile ones!

While it’s certainly true not all people are created equal in ability, motivation or orientation to a given task, this misses Horowitz’s – and the literature’s – point.

Yes, individuals matter. But the way to build sustainable capacity is not to hope to win the “good team” lottery or even think that hiring the best – most skilled, most mission motivated, etc. – is enough. It’s to build and support a group – a unit, an agency, an organization – that collectively has the skills, managerial processes and norms to generate good performance.

The World Bank’s Bureaucracy Lab has created the Worldwide Bureaucracy Indicators, among our best data sources for internationally comparative statistics regarding public sectors around the world. 

Dan Rogger, the lab’s colead, summarizes his central conclusion from the lab’s work as follows:

Government Is Fundamentally Diverse

This may seem like a tautology, but it isn’t. We often speak of government as if it were one actor, focusing on the actions of “Washington,” “London” or “Juba.”

But Washington isn’t one actor — it is closer to a society than an individual. What happens depends on what those individuals do. And what those individuals do depends substantially on their work environments, recruitment and orientation.

Those experiences can vary widely across countries. The Global Survey of Public Servants (which Rogger is a cocreator of alongside Frank Fukuyama, Christian Schuster and others) shows that 96% of Romanian public servants trust their colleagues; only 54% of Ghanaians do.

Graph showing public servants' trust in their colleagues by country
Trust in Colleagues by Country.

Great; this would seem to suggest it’s right to think of “Washington” and “Juba” — that countries matter. And they certainly do.

But this is just the tip of the proverbial iceberg. We see a similarly diverse range of responses by institution within a country.

Chart showing levels of trust within different departments of the Ghanaian government
Trust in colleagues by public servants in Ghana, broken down by government department.

Some institutions are high trust; some are low. Indeed, trust varies more within a country as does between countries.

Chart showing the variation of trust within country vs. across country
Levels of trust differs as much within Ghanaian institutions as it does between Romania and Ghana.

There is no sub-institution data publicly reported in the Global Survey of Public Servants. But if there was – if we could see differences by department – I am very confident we’d see a similar range. If we could go below departments to individual teams, I expect we’d see the same pattern again.

There’s an important takeaway here. When we talk of a government – or what it’s like to work in government – we generalize. That’s not meaningless – there are real ways in which countries differ. But the more we want to build capacity, the less useful these national-level summaries are. We care less about the entire government and more about what is happening within each team in each department.

Sometimes what these teams need is more technical skills — training in Excel or Python or (more likely these days) Claude Code. But more often it requires changing things broader than the knowledge held in one human’s head – it requires changing an organizational system.

Management that empowers – that allows autonomy, cultivates competence and creates connection to peers and purpose – is a powerful tool to improve systems. It both attracts the mission motivated and helps current employees become more mission motivated.10 It can help transform departments from places where people clock in and out to places where employees want to produce the best possible output.

Making the Whole Garment Out of the Fabric in the Pocket

Often people believe that bureaucrats in the Global South are worse at their jobs than those in the Global North. They are more corrupt, less efficient, uninterested in actually doing their job. Conversations in the Global South therefore focus instead on corruption and how control and monitoring can root it out. Indeed, the theory seems to be that the only way to improve their job performance is to control them — make sure they don’t have time to slack off, monitor every task and allow absolutely no deviation from protocol.

But there is no evidence that the people who work for government in developing countries are systematically “worse” in terms of motivation or orientation toward serving the public good than any others.11 Indeed, focusing on control is probably making the government function worse. Few high performers want to work in an environment where their bosses spend every second of the day preventing employees from doing bad things, rather than supporting them to do good things. By trying to prevent corruption, these governments are selecting for the people who are most likely to tolerate micromanagement.

In all countries, the people who work for government are people, in all their diversity and complexity. Few of these people want to be micromanaged. But we collectively fail to imagine empowered, motivated, high-performing developing world government teams. Building teams like this doesn’t require more control; indeed, it requires the exact opposite. It requires building mission alignment and trusting and empowering public servants.

There are myriad ways to support and scaffold an empowerment-first approach. To name just a few: dedicated effort to build “green tape” policies that build a defense for bureaucrats who wish to exercise judgment in service of the mission; peer discussion and empowerment; and management practices that shift culture to make intelligent risk-taking psychologically safe. Emerging technology can be a partner in this; i.e., an AI agent that can be consulted not just for information, but for permission to act in a particular way given the circumstances — enabling public servants to not feel they must risk reprimand to best serve citizens.

It is true there are civil servants who simply don’t have the skills for the job they hold. But even where skills are genuinely missing in the public service, an approach that starts with the under-skilled individual and what will give them a sense of agency, purpose and contribution is still critical. The evidence is clear that people learn best when they are motivated to learn – when they feel the autonomy, the support, the agency to put that learning to use.12 To build capacity means, first and foremost, to start with diagnosis – who the staff are, how they think about their work and what they need to want to move forward.

A capacity-building journey needs a destination – but first it needs an origin, and a pathway there. Margaret faced a seemingly impossible task – but rather than tackle it as a technical problem, she approached it as a human one. She did not prioritize monitoring her team, recognizing the impossibility of such an approach for the task in front of her.13 Instead, she treated her people with respect and dignity – she sought (and often managed) to inspire commitment to the cause that meant so much to her – getting the data right, so that better decisions could be made.

It’s Not Just About the Metrics

Margaret has said that “numbers change people’s lives.” 

I find this beautiful – and believe it to be true. But it’s only part of the story. If we zoom out just a bit, we see that it’s the Margarets of the world inspiring and managing in ways that convince the people of South Sudan’s National Bureau of Statistics that numbers change people’s lives, which in turn led to the successful gathering of those numbers.

We don’t just have to wait around for Margarets, any more than Margaret waited around to be blessed with a team that already cared deeply about the transformative power of accurate data. We can cultivate and till the soil in which such organizational cultures grow. 

Margaret took a piece of fabric and sewed it into a pocket. With the right approach, capacity-building efforts focused on how to build organizational systems that start by centering the ambitions of the many good humans who populate them might make a whole garment out of the cloth. If we all learn that from Margaret’s example, we might collectively be able to build a better world.

Dan Honig is a professor at Georgetown McCourt School of Public Policy and associate professor at University College London’s Department of Political Science. He works on improving the organization of government – usually by taking more account of the people who work for it – with the aim of bettering citizens’ lives and the relationship between states and citizens.

If you have comments on this article, or wish to contribute to the discussion, please email them to letters@indevelopmentmag.com. Responses will be featured in a letters section.

  1. I was writing a book on mission motivated public servants and their importance; a full profile of Margaret appears in Dan Honig, Mission Driven Bureaucrats (Oxford University Press, 2024). ↩︎
  2. At time of writing South Sudan’s minister for trade and industry. ↩︎
  3. Greg Larson, Peter Biar Ajak and Lant Pritchett, “South Sudan’s Capability Trap: Building a State with Disruptive Innovation,” (CID Working Paper 268, Harvard Kennedy School, 2013). ↩︎
  4. Utz Pape and Luca Parisotto, ”Estimating Poverty in a Fragile Context: The High Frequency Survey in South Sudan” (Policy Research Working Paper 8722, World Bank, 2019). ↩︎
  5. Erin McDonnell, Patchwork Leviathan: Pockets of Bureaucratic Effectiveness in Developing States (Princeton University Press, 2020). ↩︎
  6. Merilee Grindle, “Divergent Cultures? When Public Organizations Perform Well in Developing Countries,” World Development 25, no. 4 (1997): 481-495. ↩︎
  7. See e.g., Oriana Bandiera, Michael Carlos Best, Adnan Qadir Khan and Andrea Prat, “The Allocation of Authority in Organizations: A Field Experiment with Bureaucrats,” Quarterly Journal of Economics 136, no. 4 (2021): 2195-2242; Imran Rasul, Daniel Rogger and Martin J. Williams, “Management, Organizational Performance, and Task Clarity: Evidence from Ghana’s Civil Service,” Journal of Public Administration Research and Theory 31, no. 2 (2021): 259-277. More research in this vein reported and summarized in Honig, Mission Driven Bureaucrats.
    ↩︎
  8. Michael Best, Jonas Hjort and David Szakonyi, “Individuals and Organizations as Sources of State Effectiveness,” American Economic Review 113, no. 8 (2023): 2121-67. ↩︎
  9. Ben Horowitz. The Hard Thing About Hard Things (Harper Business, 2014). ↩︎
  10. Honig, Mission Driven Bureaucrats. ↩︎
  11.  See Honig, Mission Driven Bureaucrats, 63-6 for an overview of these data. ↩︎
  12. This is a vast literature but for a meta-analysis/overview see e.g., Joshua Howard, Julien Bureau, Frédéric Guay, Jane Chong and Richard Ryan, Student Motivation and Associated Outcomes: A Meta-Analysis From Self-Determination Theory,” Perspectives in Psychological Science 16, no. 6 (2021):1300-23. ↩︎
  13. Though reporting and performance appraisal were still present, as they must be in any good functioning system; the question is one of relative emphasis, not the existence of any controls. ↩︎

Even as global progress against poverty seems to slow, India has remained a bright spot. In the last several decades, the now most populous country’s transformation has been nothing short of extraordinary, with per capita incomes increasing by over a factor of six in a quarter century.

The share of the country’s population living in extreme poverty has been slashed, as has the rate of child mortality, which fell by nearly 80% from 1993 to 2021.

So why are its children so short? Even as India’s per capita income has outpaced the per capita incomes of many of its counterparts in Sub-Saharan Africa, India’s children remain some of the shortest in the world—much shorter than their peers in Sub-Saharan Africa. India is a rising giant, but its children are anything but.

Chart of height-for-age z-score vs. ln(GDP/capita) in Africa and India
Indian children are shorter than African children at comparable income levels.

To readers in rich countries, this fact may not immediately come across as cause for concern. Height is a product of genetics, so short Indian children may simply reflect differences in potential heights across ethnic groups. Indians may simply be a short people—genetically prone to being shorter than Africans or Europeans.

Thinking of height as predominantly a product of genetic inheritance, however, is a luxury of having a high income. In the United States—and other rich countries—children rarely eat too little or become too sick to grow to their full potential height. There, height largely is a product of genetics. This is not the case in many poor countries, where malnutrition and childhood disease abound. Many people in poor countries are short in adulthood not because of short parents, but because they do not eat enough or are too sick in childhood to grow. Calories in, centimeters out.

Childhood stunting can have lasting implications. Economists have long shown that taller people earn more. This result is likely not because employers simply prefer tall people; rather, nutrition also matters for cognitive development. Malnourishment starves the growing brain of much-needed energy, and stunting may be a physical sign that children are not achieving their maximum cognitive potential. Furthermore, if malnourished children are stunted both physically and cognitively, effects may persist long beyond childhood. Full nutrition in adulthood may be insufficient to make up for deficits early in life.

Governments therefore care a great deal about how short their citizens are. They also want to know why children aren’t getting what they need to grow. It behooves a government to know if it is childhood illnesses, sanitation or another factor at play. Without this information, they risk not only a physically but cognitively stunted generation. Though heights no longer remain our only measures of population well-being, they are a useful and transparent yardstick. For that reason, measuring them has become a central part of many household survey programs, including India’s National Family Health Survey (NFHS).

Heights are also relatively easy to measure. It is much easier to pull out a measuring tape than collect a blood sample. We can even look at historical data to see the rise and fall of civilizations.

One of the most transparent ways to see the declining fortunes of Native Americans in the American Great Plains is through falling heights. Native Americans were once some of the tallest peoples in the world, a status they abruptly lost with the slaughter of the bison at the end of the 19th century.

So: Rich countries should have tall kids. And as countries get richer, their kids should get taller. But in this simple taxonomy, India is a dramatic outlier. Heights have grown alongside the country’s per capita income, but at a remarkably slow rate—much slower than in other countries.

Is it just genetics? It can be difficult to tell, because you have to disentangle a person from the place where they live. Telling whether a child in Bihar is short because they live in India or are Indian is an impossible task that even the best econometric tools cannot hope to resolve. To find answers, researchers therefore study people for whom person and place are decoupled: immigrants. 

Economists Caterina Alacevich and Alessandro Tarozzi do just that, studying Indian families who migrate to the United Kingdom. When they arrive, Indian immigrants are shorter than native Brits. However, remarkably, their young children are as tall as their British peers, catching up in a matter of one generation.

This finding is striking. It does not seem to be simply that Indians are just shorter than Africans (or Brits). Something causes Indian children to stand shorter than the children of other nations. And whatever that something is does not fit in the overhead compartment when flying from Delhi to London.

If it’s not genetics, then what explains the Indian height enigma? One answer may be (eldest) son preference. Thirty-five years ago, Nobel Prize-winning economist Amartya Sen drew the world’s attention to an unsettling fact: The world had fewer girls than it should, with many Asian and African countries having a larger male than female population. The number of “missing women,” and the reasons they are missing, are controversial, but researchers often point to causes like sex-selective abortion or female infanticide.

Even when girls are born, though, they may receive fewer resources. In India, eldest sons in Hindu families often play important social roles, living with aging parents and inheriting property. Eldest girls—or indeed, girls in general—play no such role. This may encourage poor families—with only limited resources—to prioritize eldest sons over other children. In a paper in the Quarterly Journal of Economics, for example, economists Seema Jayachandran and Ilyana Kuziemko show that women stop breastfeeding daughters earlier if they do not have older brothers. Because breastfeeding suppresses ovulation and delays the return of fertility, mothers without sons may wean their daughters earlier in the hopes of conceiving a boy. 

Perhaps it is simply that eldest children, regardless of gender, get the resources. In the American Economic Review, Jayachandran and Rohini Pande argue this is the case in the aptly named paper “Why are Indian Children So Short?”  showing that though on average Indian children are shorter than African ones, this is not true for all types of children. Firstborns in India are as tall as their counterparts in Sub-Saharan Africa, but a gaping divide emerges for non-eldest children. Thirdborns and later in India are a third of a standard deviation shorter than their counterparts in Sub-Saharan Africa, compared to no gap for firstborns. Eldest sons are prioritized, and eldest daughters—by nature of their age—are less likely to have an older brother to compete with for resources during the nutritionally vital early years of life. This favoritism may come at the expense of later-born children.

Chart of height-for-age z-score vs. birth order in both Africa and India
Birth order affects height much more in India than in Africa.

Jayachandran and Pande’s paper has been very influential in academic economics, becoming a somewhat definitive source on the role of son preference in Indian society. However, their claims have not gone unchallenged. Diane Coffey, a sociologist, and Dean Spears, an economist and demographer, both of the University of Texas at Austin, have questioned the birth order hypothesis.

What could explain the fact that firstborn sons are taller than second or thirdborns? One answer is Jayachandran and Pande’s—eldest son preference. Another is that firstborns come from different kinds of families than second or thirdborns. The sample of firstborns across a whole population includes many kids from families with one child. Secondborns, by contrast, come from families with at least two children, and thirdborns necessarily come from families with at least three kids. In a recent paper, Spears and Coffey alongside economist Jere Behrman show that this effect is important in India, where larger families are also generally poorer. In other words, firstborns without siblings are more likely to come from richer families, where it is less likely that children won’t have enough to eat. Jayachandran and Pande are aware of this fact, and adjust for maternal characteristics to try and account for it. However, Spears, Coffey, and Behrman argue that conditioning on family size directly largely eliminates the link between birth order and children’s height.

If eldest son preference is not a silver bullet, then what can explain why Indian children are so short? The best alternative answer we have may lie with where people in India use the bathroom.

Alongside nutritional inputs, children’s heights are a product of their disease environment in childhood. Parasitic worm infections can sap nutrients from growing children, and diarrhea caused by exposure to fecal pathogens can induce violent and dangerous losses of fluids and nutrients. Avoiding these outcomes largely comes down to improving sanitation, which remains poor in many developing countries.

Despite its rapid economic progress, India remains an outlier in sanitation coverage as well. In 2019-21, large shares of India’s population primarily defecated in the open—that is, not in a toilet or latrine, but simply … on the ground. In a densely populated country, this is a recipe for public health concern. Fecal bacteria wreak havoc on children’s digestive tracts, in many cases causing chronic gut infections that limit nutrient absorption. These concerns have prompted global campaigns to eliminate open defecation, from a Gates-funded moonshot to invent a “next generation toilet” to an aptly named theme song and social media campaign from UNICEF India.

Whether, why and to what extent open defecation persists in India are controversial questions, with at times surprisingly vicious politics behind them. In 2019, Prime Minister Narendra Modi declared India “open defecation free”—thanks largely to the Swachh Bharat Mission, an initiative aimed at eliminating the practice in part through the construction of over 100 million latrines.

Many have called this claim into question, in part because of clear evidence to the contrary in the National Family Health Survey (NFHS), a national household survey program, one round of which began that year. Between 2015-16 and 2019-21, the share of households reporting that they practice open defecation fell from 55 to 27%—an impressive drop, but far from elimination.

Importantly, the way NFHS asks about open defecation may also overstate progress. Asking whether each member of a household defecates in the open yields higher rates than asking whether a household collectively does. Even in households where some members use a latrine, other household members may continue to defecate in the open. This would mean that as a percentage of population, far more than 27% could defecate in the open.

Coffey and Spears’s research suggests that this may be more likely than son preference to explain the disappointingly low stature of India’s children.

There is some evidence to suggest it could be. Randomized experiments comprising interventions aimed at improving sanitation coverage have pointed to at times positive effects on children’s heights. Descriptive evidence also suggests that differences in sanitation coverage are more than sufficient to explain the Indian height enigma: If reweighted to take into account India’s density of open defecation per square kilometer, African heights would look remarkably similar to Indian heights.

Though strategies like community-led total sanitation—wherein latrine construction is paired with behavioral change interventions, often aimed to invoke “shame” among those who defecate in the open—can yield meaningful improvements in sanitation, they are far from a silver bullet. Evaluating whether, in an open defecation-free environment, India’s children would grow as tall as their counterparts in Africa is a difficult if not impossible counterfactual to construct.

It is possible that both stories are at least some of the explanation. Indian girls could receive fewer resources than their brothers and Indians might suffer from the likelihood of open defecation. Those aren’t even the only two hypotheses in the literature. Alongside poor sanitation and cultural norms emphasizing the importance of eldest sons, Indian diets are often high in carbohydrates and low on proteins and micronutrients, failing to meet dietary diversity standards. At least descriptively, these patterns can explain some of the disparities in stunting rates across districts of India. But isolating this effect causally is challenging. Diets are difficult to randomly assign, meaning researchers are forced to rely on “natural experiments.” One paper, leveraging exposure to India’s “Green Revolution” as a source of variation, finds that improved yields of wheat and rice reduced heights, perhaps as a result of reductions in protein intake and dietary diversity.

Litigating these debates is a challenge and a parable for just how difficult finding answers to even the most simple and consequential of questions can be. The Indian height enigma is also an allegory for the power of data at a time when the infrastructure essential to measuring progress—both in India and globally—is teetering on the edge. 

Prior to the 1980s, the world was remarkably devoid of data on the lives of the world’s poorest people; working out who was most deprived or what people died of was much harder and depended on less systematic information. At that time, we would not even know that Indian children were short, let alone have the ability to determine why. Household survey programs lent researchers new scope to examine the world and uncover paradoxes and facts with remarkably broad implications. A data-rich future is far from assured, however. In India, data collection has also taken a remarkably political turn, with a long-delayed census sparking controversy.

The most recent round of the NFHS—which was released just two months before this piece went to print—provides some promising signs that rates of stunting among India’s children have continued to fall. However, the convenient removal of data points related to sanitation, childhood sex ratios, and anemia—at least in early reports from the survey—will make the causes of this progress much harder to parse. The Indian enigma will likely continue to baffle, especially if the data used to interrogate it is allowed to slip away.

Wilson King is a PhD student in development economics at the University of California, Berkeley. His research focuses on health in low and middle-income countries.

cartoon of a man pretending to be as tall as a cardboard cutout

If you have comments on this article, or wish to contribute to the discussion, please email them to letters@indevelopmentmag.com. Responses will be featured in a letters section.

History remembers two Robert McNamaras.

Lingering in public memory is McNamara as US secretary of defense—the architect of America’s escalation in Vietnam and, for a time, one of the most vilified figures in the country. Then, for a thin slice of development specialists, Robert McNamara is remembered as president of the World Bank. From 1968 to 1981, he led a second war, the war against global poverty, a struggle to which he dedicated extraordinary personal effort—but a war which, for him, ended also in disillusionment.

It is tempting to try and separate the two McNamaras. His tenures at the Pentagon and the World Bank each deserve, and have received, the space of a full-length biography. The two chapters of his life—as head of the “greatest war machine in the history of the world,” then antipoverty crusader—clash like thesis and antithesis.1

But, when considered together, the two wars of Robert McNamara’s life reveal a common approach, one that defined the postwar era of global development. Nicknamed “an IBM machine with legs,” McNamara was the living embodiment of midcentury American technocracy—a man who brought an ambitious drive to scale, a rationalizing impulse, and (most of all) a faith in the power of quantification to solve our most pressing social problems.

“To this day,” he wrote near the end of his life,2 “I see quantification as a language to add precision to reasoning about the world. Of course, it cannot deal with issues of morality, beauty, and love, but it is a powerful tool too often neglected when we seek to overcome poverty, fiscal deficits, or the failure of our national health programs.”

This approach made McNamara’s early career a glittering success. During World War II, he brought statistical control to the US Air Force’s bombing of Japan. At 24, he was made the youngest assistant professor at Harvard Business School. At 44, he became the first person outside the Ford family to preside over the Ford Motor Company—a job he left after just five weeks, to join President John F. Kennedy’s cabinet. At the Pentagon, and then the Bank, he presided over massive increases in spending, bending these huge bureaucracies to his will and reassembling them into their modern forms. 

And yet, when the sum total of his career is considered, the overwhelming sense is one of failure. The final years of McNamara’s life were spent reckoning with the wreckage of his legacy. 

Where did things go so wrong?

Something Rotten in South Vietnam

In 1960, the newly elected John F. Kennedy offered McNamara the choice of secretary of the treasury or secretary of defense. McNamara, who claimed to know little about finance, chose defense. Amid the arms race with the Soviet Union, he was now in charge of 9% of all spending in the US economy, and more than half of every federal tax dollar. 

His first task was bringing this spending to heel. He introduced the Planning, Programming, and Budgeting System (PPBS), which helped coordinate spending across the army, navy, and air force, and remains the main way the Pentagon allocates funds. With advice from the RAND Corporation, he created a new Office of Systems Analysis, which centered cost-effectiveness as a criterion for spending. It was perhaps the first serious attempt by a civilian to exert control over the Department of Defense—and remains the foundation of defense procurement to this day.

McNamara later said that, had Kennedy not been assassinated, the United States would not have become entangled in Vietnam. Perhaps, then, McNamara might have been remembered by history as a technocratic reformer. But under President Lyndon B. Johnson, McNamara instead became known as one of the fiercest advocates of escalation.

Robert McNamara pointing at a map of Vietnam during a press conference.
Robert McNamara pointing at a map of Vietnam during a press conference. Photo by Marion S. Trikosko; reproduced from the Library of Congress.

As head of the Pentagon, McNamara presided over a massive scale-up in South Vietnam. In 1961, there were still just 3,200 American troops in-country. By 1968, there were over half a million. From 1965 to 1970, they were fed and supplied by 3 million tons of dry goods shipped by sea. (This transpacific traffic would later set off the containerization revolution in global trade.) Overhead, American planes would eventually drop 7.5 million tons of bombs on Vietnam, more than double the amount dropped on Europe and Asia during World War II.

But the Vietnam War was more than just a military conflict. The need to “win hearts and minds” put questions of development at the center of the war—and although South Vietnam ceased to be a country over 50 years ago, it remains the fourth-largest recipient of US foreign aid in history. Perhaps without fully realizing it, McNamara was presiding over a massive, quixotic effort to develop a country that had not asked for it.

The Pentagon’s strategy was informed by a vast new statistical apparatus, the Hamlet Evaluation System. Starting in 1967, every month, an army of surveyors canvassed 12,000 hamlets (subunits of villages) in an active warzone. Hamlets were graded on a scale from “A” for friendly to “E” for contested, based on recorded attacks by Viet Cong or North Vietnamese forces. Alongside the wartime metrics were a host of other variables: questions about levels of education, the state of public works, conditions in agriculture.

Each month, the data from the Hamlet Evaluation System would be fed into an IBM 1410, which would spit out time-series plots that invariably showed that the US was winning the war. Another grisly statistic, the crossover point, measured the juncture at which more North Vietnamese and Viet Cong were being killed than could be replaced. Yet despite the mounting body counts, the tons of bombs dropped, and the purported success of pacification schemes, the North Vietnamese showed little interest in coming to the bargaining table.

The problem, McNamara’s critics stated at the time, was mistaking the war as something that could be understood as a purely quantitative exercise. Counting enemy casualties or pacified villages measured what was legible at the expense of what was strategically important. The North Vietnamese proved willing to absorb losses that American planners did not anticipate. By contrast, fundamental reform to address the root causes of why the Vietnamese were fighting—such as land reform to benefit peasant farmers—was delayed until it was too late.

Archival evidence suggests that McNamara had realized as early as November 1965 that the war could not be won—just months after he had pushed for massive escalation. Within the closed doors of the Johnson administration, he began advocating for a negotiated peace. Quietly, he also assembled a team of analysts, including the economist Daniel Ellsberg, to compile a set of secret papers on the errors of judgment that had led to American involvement.

Yet, for almost two years, McNamara continued to go out and sell the war to the American people. In November 1966, he told the press that “military victory [for the North Vietnamese and Viet Cong] is beyond their grasp.” In 1968, in a statement to the Senate Armed Services Committee, he claimed the Government of South Vietnam was making “encouraging progress.”

The cost of McNamara’s silence was enormous. Although precise estimates are impossible, perhaps 100,000 to 150,000 Vietnamese civilians were being killed each year. From 1965 to 1968, American deaths averaged over 9,100 a year. Decades later, landmines planted during the war were still mutilating children. The carcinogen Agent Orange—sprayed wantonly over fields and villages—is estimated to have caused another 400,000 excess deaths. 

When pressed years later on why he had remained silent, McNamara responded with the limp excuse that his ultimate loyalty lay with the president. (Notably, Cabinet secretaries swear their oath of office to defend the Constitution, not the president.) Perhaps he also believed that he could still influence the administration’s policy from the inside. For McNamara, the consummate system builder, it was impossible to imagine himself on the outside.

Privately, the cost of continuing the lie exerted a psychic toll. At night, McNamara ground his molars down to stumps, forcing a painful dental operation. His college-aged son and daughter turned against him. The tension between the sunny and confident public McNamara, and the haunted and doubt-ridden private one, was unsustainable.

President Lyndon B. Johnson and McNamara in the Cabinet Room in 1968.
President Lyndon B. Johnson and McNamara in the Cabinet Room in 1968. Photo courtesy of the National Archives.

At the end of 1967, President Johnson announced that he was nominating McNamara to be president of the World Bank. Johnson had grown tired of McNamara’s doubts; McNamara, having reportedly suffered a mental breakdown, took the offer. Years later, he recalled telling his friend Katharine Graham, the publisher of The Washington Post, that he didn’t know if he quit or was fired.

“You’re out of your mind,” she said. “Of course you were fired.”

McNamara’s Bank

Bruised and drained by his final years as secretary of defense, McNamara found new vitality in the task of remaking the World Bank.

The Bank in 1968 was riddled with contradictions. It had been created to support the postwar rebuilding of Europe, but had been largely bypassed by the United States in favor of the Marshall Plan. It had pivoted to lending to developing countries (starting with a loan to Chile in 1948), but it still depended on capital from Wall Street, whose conservatism chafed at the risks of lending to poor countries. The result was a portfolio that was, in McNamara’s words, “small and patchy”—around $10 billion in today’s dollars, compared to the current portfolio of $120 billion.3 Moreover, the Bank had no central accounting system, no processes in place to evaluate the impacts of its lending, and no systematic projections of its loan portfolio. According to McNamara, a culture of “leisurely perfectionism” prevailed at the Bank; the process for finalizing projects was slowed by unnecessary technical reviews, and deadlines often slipped.

For a man of McNamara’s ambitions, this was unacceptable. He worked 12-hour days, divided meticulously into 15-minute blocks. He travelled constantly to the developing world, and made a point of venturing outside of capital cities and boardrooms, to see what the living conditions of the poor were really like. McNamara said little publicly about what drove this frenzy of activity. Any connection with demons from Vietnam must be heard in the silences. But his assistant, Olivier LaFourcade, said that it seemed as if “the emotions of a highly emotional person were subdued, controlled.”4

Just as he had at the Pentagon, McNamara first sought to exert centralized control over the Bank’s sprawling operations. He ordered the Bank’s senior managers to draw up standardized tables of its lending, and developed the “country program paper,” a common framework for Bank staff to evaluate member countries. A new Programming and Budget department controlled the allocation of resources within the Bank. In 1970, faced with the looming threat of a US Congressional audit, he created the Operations Evaluation Unit to monitor the performance of the Bank’s loans. In 1973, Bank management even pushed to measure the “social rate of return” of development projects. Staff resisted, and the change was scrapped.

Having consolidated his power within the Bank, McNamara next brought his relentless drive to scaling operations. He grew the Bank’s staff more than threefold, from 1,600 employees to 5,700, and began hiring economics graduates from the top American and European schools, transforming the Bank from an institution run by engineers to one dominated by economists. He canvassed Europe, Asia, and the Middle East, expanding the Bank’s pool of creditors beyond Wall Street. He brought on the talented financier Eugene Rotberg, who invented the world’s first currency swap to facilitate the Bank’s borrowing. In total, over McNamara’s presidency, the Bank’s yearly lending grew from around $1 billion in 1968 to $13 billion in 1981—an annualized growth rate of 20%, a pace which no other World Bank president has matched.

There were growing pains. McNamara’s focus on hitting lending targets created incentives to push money out the door, with, Nancy Birdsall notes, “relatively little regard for how it would be used.” To avoid missing targets, loans “bunched” up around key reporting deadlines, a phenomenon that persists at the Bank. A decade later, an internal audit of the Bank found evidence of an “approval culture,” which, ex ante, was overly optimistic about projects’ prospects and, ex post, did little to assess their outcomes.

But the positive imprint McNamara left on the Bank also cannot be denied. The skills he had once applied to the escalation of Vietnam—the drive to scale, the bureaucratic command, the impulse to rationalize and quantify—found a productive new quarry in the struggle for global development. Indeed, during McNamara’s early Bank presidency, aid became central to growth in a way it has not been before or since. In 1970, official development assistance was responsible for 10% of investment in low- and middle-income countries (LMICs), and 16% of their imports. By comparison, in 2021, aid accounted for just 2% of investment and 3% of imports in LMICs.

A War on Global Poverty

By the 1970s, however, it was clear that growth was not having the expected effects on poverty throughout the developing world. Despite progress in capital accumulation and infrastructure, the benefits were simply not flowing down to the world’s poorest. A 1972 report by the International Labour Organization described unemployment as “chronic and intractable in nearly every developing country… and will not be cured simply by accelerating the rate of growth.” 

In a landmark speech at the 1973 annual meeting of the World Bank and International Monetary Fund (IMF) in Nairobi, McNamara announced a new course. He called for a focus on what he called absolute poverty—“a condition of life so degraded by disease, illiteracy, malnutrition, and squalor as to deny its victims basic human necessities.” The narrow focus on “growth of GNP [gross national product]” missed central questions of inequality and distribution; the Bank must take “action… which will directly benefit the poorest.” Notably, McNamara called for tenancy and land reform—policies he had resisted in Vietnam—arguing that an “increasingly inequitable situation will pose a growing threat to political stability.”

Outside events accelerated the Bank’s turn toward global poverty. The 1973 OPEC crisis sent commodity prices soaring, encouraging commodity producers to demand fairer terms of trade and resource sovereignty. In May 1974, a special session of the UN General Assembly spearheaded by developing countries declared a New International Economic Order (NIEO), demanding technology transfers from the rich world, debt relief, and the reform of international institutions like the Bank and the IMF. In December, a subsequent vote for a new Charter of Economic Rights and Duties of States was 120 in favor and 6 against, with 10 abstentions. Every single developing country voted in favor. The 6 against were the United States, the UK, West Germany, Luxembourg, Belgium, and Denmark.

The NIEO represented a major challenge to the US-led international order. McNamara was sympathetic to its arguments—to a point. His moral commitment to the global poor was genuine. But he refused to advocate for deep structural reforms, such as those that might have increased the representation of poor countries at the Bank. With his close ties to the Washington DC political establishment, McNamara generally refused to buck Administration policy—by his own admission, “the US treated the Bank as though it were a US institution.” Modern econometric research suggests that countries that were diplomatically aligned with the US benefited from faster disbursement of loans and looser conditions.

The Bank’s new focus on the global poor produced some notable successes. River blindness, a disease caused by the parasitic worm Onchocerca volvulus, was virtually eradicated thanks to a Bank program with the World Health Organization—by 2002, around 600,000 cases of blindness had been prevented, largely in West Africa. A bronze statue in the World Bank atrium, of a child leading a blind man, marks the achievement.

Photo of statue in the lobby of the World Bank
A statue at the World Bank headquarters symbolizes the collaborative effort to combat river blindness. Photo by Karol Karpinski.

But, in the late 1970s, the same structural force that had motivated the Bank’s antipoverty turn—the global rise in commodity prices—began to undermine it. With most developing countries net importers of oil, rising prices forced them to take on debt to finance spending. To address this unfolding crisis, in 1979, McNamara introduced a new lending vehicle, the structural adjustment loan, intended to shore up a government’s general finances rather than support a specific project. In exchange, borrower countries were required to implement macroeconomic reforms: cutting government spending, opening up to trade, and liberalizing the domestic economy.

These first structural adjustment loans—$55 million to Kenya and $200 million to Turkey in 1980—marked the start of the Bank’s departure from the postwar recipe of state-led growth. Over the 1980s and 1990s, this would coalesce into what became known as the Washington Consensus—a mix of market-oriented reforms that emphasized fiscal discipline, liberalization, and the retreat of the state from active economic management.

The economic legacy of this period remains deeply contested. On the one hand, William Easterly finds no evidence of a relationship between structural adjustment loans and better policies or faster growth—perhaps because many of the reforms were never actually undertaken. On the other, defenders of the Consensus point to faster long-run GDP growth among reformers in the 2000s. Outside of economics, public health research suggests that structural adjustment programs, when implemented, led to declines in child and maternal health, likely from cuts to social spending—although this finding is controversial. Separating the effects of structural adjustment from the economic crises that led to those conditions being imposed may simply be an intractable question. 

Whatever their precise economic effect, the structural adjustment loans were seen as an expression of the imbalance of power between rich lenders and poor borrowers—precisely the asymmetry that the New International Economic Order had tried to correct. 

Moreover, the World Bank’s conditions became publicly associated with the economic disappointment of the 1980s and 1990s. With the afterglow of independence fading, sub-Saharan Africa fell into political instability and economic decline. Growth in Latin America stalled and even reversed amid a wave of debt crises. Morale at the Bank reached a low ebb. McNamara’s dream of a world without poverty, expressed so vividly in Nairobi in 1973, had been perverted beyond recognition. He resigned in 1981, a few months after the death of his wife.

McNamara’s Silence

After the World Bank, the last third of McNamara’s life was dominated by trying to confront the ghosts of Vietnam. He read widely, travelled extensively. In 1995, he even went to Hanoi, where he dined with his former North Vietnamese adversaries. (They almost came to blows.)

McNamara’s 1995 biography, In Retrospect, was his first public attempt to come to terms with the past. The book, which is almost entirely about Vietnam, begins with McNamara’s admission that “we were wrong, terribly wrong,” then chronicles the errors of judgment that led America into a quagmire. It makes little mention of his time at the Bank.

In Retrospect was widely panned. For longtime critics of the Vietnam War, it was too little, too late. In his review for the Los Angeles Times, David Halberstam wrote:

Had it been published 25 years ago while the battle itself and the debate over it was still raging—had McNamara come forth then and said, as he does here, that what had come to be known as “McNamara’s War” was “wrong, terribly wrong,” it would have been an extremely valuable part of the ongoing debate; indeed, it might have ended the debate then and there. A secretary of defense of his seeming certitude who came forward and said that he had been mistaken in his earlier estimates and that the war could not be won would have been the most powerful of witnesses…

McNamara’s second attempt to confront his place in history, the 2003 Errol Morris film The Fog of War, was better-received.

Then eighty-five, his face as wrinkled as an almond, McNamara stares directly into the camera and speaks with a crisp lucidity that belies his age. As a byway to Vietnam, he recounts his days in the air force during World War II, when he advised General Curtis LeMay on the firebombing of Tokyo—an operation, he admits, in which they were “behaving as war criminals.”5 He describes the 13 days of the Cuban Missile Crisis as one of the central American decision-makers, when the world came to the brink of nuclear war. The lesson flashes by in a title card: “rationality alone will not save us.”

And yet that message seemed to elude McNamara, even toward the end of his life. If there is a thread we can trace through his career, from the Pentagon to the Bank, it is that no amount of technocratic skill can substitute for ethical judgment. McNamara was one of the 20th century’s great systems builders—a man who could tame vast bureaucracies, enlarge them, rationalize them. That doing what was right might require sometimes stepping outside the system simply did not compute.

cartoon of a man hitting both screws and nails with a hammer

Even after McNamara was forced out by Lyndon Johnson, he refused to publicly come out against Vietnam, repeating the justification that former secretaries of defense should not contradict sitting presidents. At a 2004 event at Berkeley promoting The Fog of War, with the United States entangled in two more foreign wars, McNamara refused to criticize the Bush administration, citing the same principle.

When asked by Errol Morris if he felt responsible for Vietnam, McNamara refused to answer.

“Is it the feeling that you’re damned if you do, and if you don’t, no matter what?” asked Morris.

“Yeah, that’s right,” McNamara said. “And I’d rather be damned if I don’t.”

But one thing stood out to me on rewatching The Fog of War. Notice how quick McNamara is with his figures, particularly those marking human life. He remembers that Allied bombing destroyed 58% of Yokohama, 51% of Tokyo, 99% of Toyama. When asked, he can recite that 25,000 were killed in Vietnam by the end of his tenure at the Pentagon—“just under half,” he points out, of the 58,000 who eventually died. 

But also see the pride on his face when he points out that introducing seatbelts at Ford saved 20,000 lives a year. Or when he notes the thirteen years he spent at the World Bank (compared to seven at Defense) working on global poverty.

Perhaps he hoped that there was still a way to make the figures square, to at least net out some of the red. McNamara, who died six years later, was beholden to the numbers to the end.

Photo of Robert McNamara's grave
Robert McNamara’s grave in Arlington National Cemetery. Photo by Tim Evanson; CC BY-SA.


Oliver Kim is a development economist working as a Research Fellow on Coefficient Giving’s Global Growth Fund.6 He writes a Substack called Global Developments.

If you have comments on this article, or wish to contribute to the discussion, please email them to letters@indevelopmentmag.com. Responses will be featured in a letters section.

  1. David Halberstam, The Best and the Brightest (New York: Random House, 1972), 220. ↩︎
  2. Robert McNamara, In Retrospect: The Tragedy and Lessons of Vietnam (New York: Random House, 1995), 6. ↩︎
  3. William Taubman and Philip Taubman, McNamara at War (W. W. Norton & Company, 2025), 321. ↩︎
  4. Ibid, 331. ↩︎
  5. Today, the idea of a secretary of defense admitting fault, let alone confessing to war crimes, seems nearly unthinkable. A second Morris documentary, 2013’s The Unknown Known, on former US defense secretary Donald Rumsfeld, is almost unbearable to watch, as Rumsfeld eludes almost any attempt at self-reflection. ↩︎
  6. Another team within Coefficient Giving, the Effective Giving & Careers team, is a funder of In Development. They played no part in our editorial decision to commission, edit and publish this piece, and Oliver is writing in his personal capacity. ↩︎
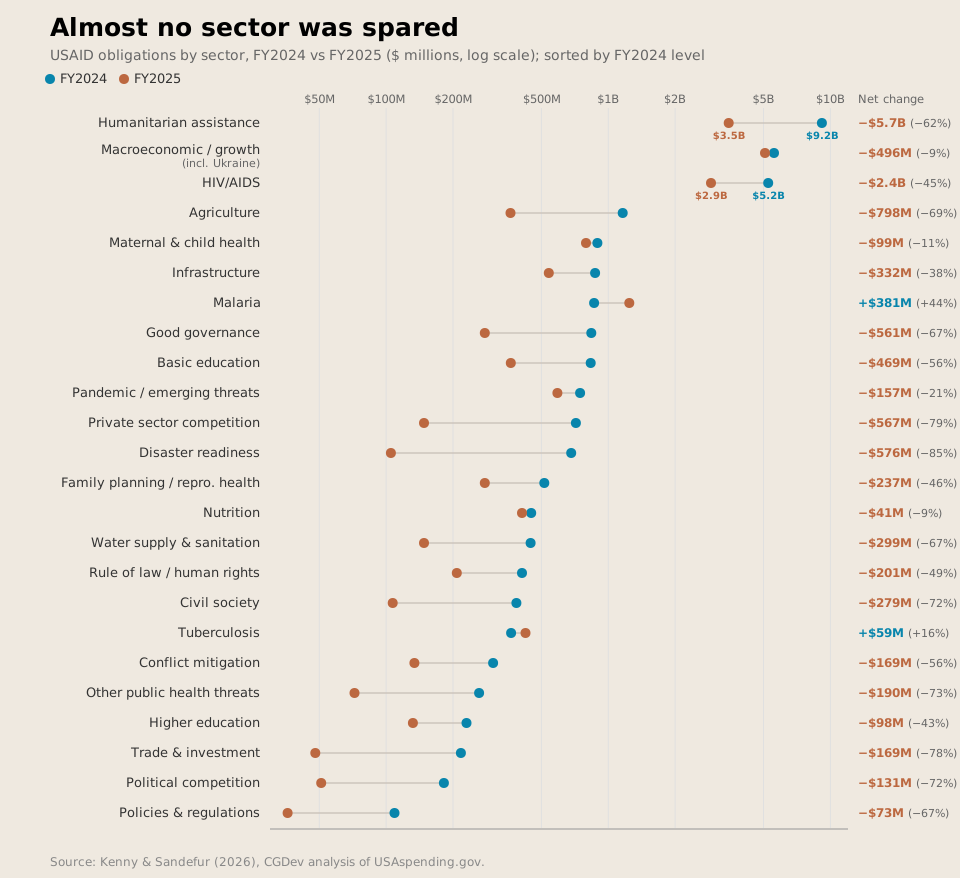
We’re back! We will have new articles for you starting next week.

In the meantime, we have reader responses to our previous pieces. We’d love to publish your reactions as well – please email letters@indevelopmentmag.com.


In response to Nithin Coca’s Jakarta’s Remarkable Urban Transformation

Dear Editors,

Nithin Coca’s piece on Jakarta’s transit transformation is welcome, optimistic coverage of a city that has faced heavy pessimism from foreigners (mostly undeservedly, sometimes deservedly). Coca is right that there has largely been a positive institutional shift towards public transportation, but I am writing to push back on three things: the framing of the MRT as the central reform in Jakarta’s public transportation, the triad of lessons that don’t hold up, and the idea that Jakarta has done “the hardest part” on public transportation reform.

First, the MRT. It is clean, fast, and pleasant to ride – but congestion relief from the MRT is limited. With only one 16-kilometer line (inaugurated in 2019 after decades of delays), there have very limited improvements to traffic across the city – only some alleviation along corridors directly adjacent to the line. Meanwhile, as Coca writes, Jakarta continues to add roughly 400,000 residents per year, and the private vehicle fleet has grown alongside the rail network. In this sense, public transportation is likely serving a new wave of demand rather than shifting existing habits.

Second, the triad falls short in a few ways. First, international investment was necessary for the LRT and MRT, but the BRT—which is now the world’s largest bus network—was created without international investment, and has even used increasing municipal subsidies to keep fares affordable. It’s important to note that there are independent possibilities of funding some public transportation, so that we can hold public officials to a higher standard.

There is no disagreement from me on the importance of political will. However, I would argue that the deciding factor comes from shared continuity of political will. Like many other democracies, Indonesia faces many abandoned projects (oops) due to changing administrations, and a stubborn refusal to engage or acknowledge programs by political rivals. Take the BRT system in Bogotá, which was started by former mayor Enrique Peñalosa: despite widespread initial celebration of the launch of TransMilenio, continued deprioritization by Peñalosa’s successors led to the bus system’s eventual decline. Jokowi played a huge and difficult role in kicking off the MRT development, but the willingness of his successors to follow through is what consolidates continued development of Jakarta’s public transportation, including fleet improvements and public transportation integration.

As for luck… I am not sure what this is supposed to suggest. Coca mentions this in his opening, then never again. It’s hard not to assume that he means we cannot succeed without some form of an amorphous, unearned advantage. We are a democracy, and we elect our leaders. In turn, they should be expected to perform. I turn back to the issue I had with the thesis that we need international investment for relieving congestion – it takes away agency and responsibility from leaders who fall short.

In terms of the “hardest part” of this process, it’s difficult to agree. Coca seems surprised that “government and external donors can coordinate to improve the urban landscape” in the article, and implies that this sets a formidable precedent. Indonesia can coordinate, albeit sometimes by sheer desperation (think of the voting logistics across thousands of islands and organizing yearly mudik), but the problem is consistency and intentionality in leadership.

Jakarta’s progress in public transportation is wonderful – but it might be too early to say it’s successful if it doesn’t keep growing consistently. The key to success isn’t one-time political will or international investment, and it is definitely not luck. It’s cohesion in governance, and it’s that we need leaders who care about the country, over and over and over again.

Faye Simanjuntak

Schwarzman Fellow at the Asia Society


In response to Charles Kenny’s “Where’s My Ministry for Emigration”

Dear Editors,

I found a lot to agree with in Charles Kenny’s article in Issue 1, “Where’s My Ministry for Emigration?” Having previously been quite concerned about the problem of brain drain, I’m now inclined to believe that in many – maybe most – contexts, ‘brain gain’ is more common: there are enough people inspired by the prospect of emigration to invest in skills that stay that overall the sending country is better off. And for countries like India producing graduates faster than the labour market can absorb them, emigration is an escape valve allowing some of those educated young people to find meaningful work without storing up the inevitable problems such frustration and disenchantment will cause.

But while I think the argument is directionally correct, I fear – as seems often to be the case with migration advocates – the case is overstated. Hoping for migration to “be the driving force behind global convergence” seems to me to expect too much. The direction of travel seems to be towards carefully controlled and managed migration – a trickle, not a flood. Bilateral Global Skill Partnerships, which coordinate the needs and contributions of sending and receiving countries, are the sorts of initiatives I would expect to see more of. But I would expect them to cover thousands of people, not millions – enough to take a small bite out of global inequality, yet hardly a large chunk.

Migration can be mutually beneficial for all involved, but we should temper our expectations as to what it can achieve.

Aveek Bhattacharya

Strategy Fellow at Coefficient Giving


In response to Daniel Yu’s “Exporters Without Borders: Why You Should Start a Company Instead of Working in Aid

Dear Editors,

Daniel’s article is thought-provoking and a good interrogation of the assumptions underlying global development work. I love the line: “A successful commercial firm does something no NGO can: it issues “cash transfers” to a large group of people every month, indefinitely, funded by the market rather than donor whims.” However, the article does not contend with the challenge that export-oriented manufacturing businesses require significant investment in public goods – for example, electricity, telecom connectivity, trade agreements, national standards bureaus, among many others. You can overcome supply chain and labour market challenges through sheer grit, perhaps, but how should budding entrepreneurs think about how to get governments to provide these public goods?

Karan Nagpal

Senior Director at IDinsight

India produces enough buprenorphine, a medication used to treat opioid addiction, to serve about 450,000 patients each year. It is treating only 45,000. How do we fix this?

India has more people who misuse opioids than any other country in the world.1 But, of the 7.7 million people in the country who meet the criteria for opioid use disorders, fewer than 2% receive any evidence-based treatment.

Opioid addiction can sneak up on people. Many who use opioids don’t realize they’re dependent until they try to quit and then experience withdrawal. In Mizoram, one of India’s most afflicted states, the literal translation in Mizo for opioid-induced withdrawal symptoms is “suffer”. For users of opioids, “suffer” is as much a description as it is a metaphor. Coming off opioids involves severe cramps that seize the abdomen, sweating that won’t stop, tremors that look like convulsions, diarrhea and vomiting, chills, and many sleepless nights. Some of these symptoms can last for weeks.

Perhaps unsurprisingly, without sustained treatment, the rates of relapse among people who use opioids run between 80% and 90%. They then put off trying to quit again, because they simply don’t want to risk feeling that degree of pain a second time. But, after a relapse, the risk of fatal overdose is particularly high. While a user’s cravings may be just as intense, their body’s tolerance has decreased. Annual mortality among people who use opioids non-medically typically ranges from 1% to 3%.

Fortunately, for the last three-and-a-half decades, there has been access to successful treatment options. Opioid agonist therapy (OAT) recommends replacing illicit opioids with prescribed doses of methadone or buprenorphine. These opioid substitutes (agonists) bind to the same receptors in the brain, so they ease the cravings that users feel without producing the same “high”. This allows users to transition away from the dangerous parts of drug use without having to suffer withdrawal. This treatment works; these medications roughly double the likelihood of staying in treatment and cut the risk of dying from a drug overdose by about 70%.

Scaling OAT, then, seems like an obvious win. The therapy is relatively easy to administer—it can be done in an outpatient setting—and is very cheap. In India, the medication itself can cost as little as 25 to 30 US cents a day. The cost is clearly worth it; treatment pays for itself several times over because every dollar invested yields “a return of between $4 and $7 in reduced drug-related crime, criminal justice costs, and theft. When savings related to healthcare are included, total savings can exceed the costs [of OAT] by a ratio of 12 to 1.”2

And yet, OAT remains woefully underused in India. Just 2% of those who could benefit from it end up getting access, while the remaining 98% are left to fend for themselves. Other low- and middle-income countries manage to treat a considerably higher percentage of those who use opioids. If India scaled OAT to even 25% coverage—still below that of countries like Malaysia, Vietnam, and Iran—it could avert 5,000 to 7,000 deaths per year.3

Sources: Dhawan et. al (2017), EUDA European Drug Report 2025, Pirnia (2024), Luong (2024)

Why is India failing on this issue?

It is not because policymakers think OAT doesn’t work. Instead, it is because three decades of policymaking have made it extraordinarily difficult to prescribe the medication, dispense it, or stay on it. India simply doesn’t trust its doctors or patients enough to implement international best practice.

Tracing the Boundaries of Opioid Use in India

Opioid use is not rare in India. About 2.1% of the Indian population uses opioids, roughly three times the world average. In any given year, about a third of those—or 7.7 million people—will engage in harmful opioid use. As a percentage of the population, opioid misuse is more common in India than in South Africa or Germany. And each year, at least 77,000 people will die from drug-related causes. This, too, is not a small number; it is similar to the number of Indians who die from breast cancer.

Injection drug users are the minority of Indian opioid users, making up only about 11% of those who misuse opioids.4 Most injection drug use in India is heroin, trafficked across borders from Myanmar. This means the epidemic is geographically concentrated in India’s northeastern states. Mizoram, Manipur, and Nagaland sit along trafficking routes from Myanmar, leaving them particularly exposed. Heroin also crosses from Afghanistan into Pakistan, and then into the street markets of India’s Punjab state.

The states of Mizoram, Nagaland, Arunachal Pradesh, Sikkim, and Manipur all have opioid use prevalence above 10% of the adult population. Between 4% and 7% of the population meet the criteria for problematic use; this is some 10 times the national average.

Source: Ambekar A et al. on behalf of the group of investigators for the National Survey on Extent and Pattern of Substance Use in India (2019).

And in these places, the consequences of use extend well beyond addiction. HIV prevalence among people who inject drugs reaches 32% in Mizoram and 18% in Tripura. Hepatitis C prevalence exceeds 60% at multiple sites in these states. Getting the rules of treatment right here could reach a disproportionately large share of the national burden of infectious diseases. 

The majority of users, though, smoke or take pills. Recently, India has seen the same expansion of pharmaceutical abuse that has been seen elsewhere in the world. India makes more generic drugs than any other country, and this includes opioid painkillers like tramadol and tapentadol, which are cheap and easy to get. Pharmacies routinely sell such drugs without a prescription. Indeed, the concept of prescription-only drugs is often more of a suggestion than a rule in many Indian pharmacies. This makes access easy and abuse more likely. About half of India’s opioid users now abuse via prescription drugs, rather than via heroin.

Getting Harm Reduction Right

To many, opioid agonist therapy does not seem like treatment at all. It sounds like simply providing drug addicts with their fix. Perhaps it is a less harmful way to take opioids, but they are still taking opioids. Is it really the role of the state to provide addicts with a different type of drug?

But to even ask the question is to misunderstand the treatment. Users on OAT do not get high, and they avoid the harmful parts of drug use. A major meta-analysis found that OAT reduces all-cause mortality by about a third to a half. It also reduces illicit opioid use, criminal activity, and the needle-sharing that spreads HIV. This is why OAT is the gold standard of treatment worldwide.

Over months and years, OAT allows people to lead stable lives in which they hold down jobs, save money, and rebuild relationships with their families. OAT treats opioid use disorder like any other chronic condition: the goal is not to get off the meds, but to have a functional, healthy life.

In rich countries, coverage is high. France treats more than 80% of its high-risk opioid users. Across the EU as a whole, roughly 60% of high-risk opioid users received OAT in 2023.

But it is not just rich countries that use OAT; it is also widely used in middle-income countries. For example, Iran began its national OAT rollout in the mid-2000s—about the same time India began scaling its program—and now delivers OAT treatment to 31% of those who would benefit from it. Vietnam’s treatment program reaches 25% of opioid users.5 India’s coverage rate is dismal by comparison: less than 2% of people in India who need it receive OAT.

How India Built The Wrong System

To understand why so many patients remain untreated, it helps to understand the history of OAT in India. Opioid agonist therapy was first introduced in India to counter the rise in HIV infections in people who injected opioids. HIV prevalence among people who inject drugs is more than thirty times the average prevalence.

OAT can help reduce these numbers. A patient stabilized on a daily oral dose of medication no longer feels the same degree of craving to inject other opioids, and the needle-sharing that drives infection stops.

So, the national scale-up of opioid agonist therapy began in 2007-08 through the National AIDS Control Programme. The goal was explicit: to reduce needle-sharing and HIV prevalence among those who inject opioids. At the time, this made sense; people who injected drugs made up a large and growing proportion of new HIV cases. India needed to reduce new HIV infections, and that meant OAT for injection drug users.

Even this was politically challenging. Since buprenorphine and methadone are opioids themselves, critics called the government an “official drug dealer.” In some ways, the government appeared to agree; the 2012 National Policy on Narcotic Drugs and Psychotropic Substances described OAT as treatment in which “an injecting drug user is supplied buprenorphine or methadone and persuaded to abuse them orally instead of injecting heroin or other drugs.”

The government treated OAT as if it were a stop on the way to recovery—a slightly shameful stop at that. The policy went on to impose a one- to two-year cap on agonist treatment, insisting that patients be switched to “de-addiction as soon as possible preferably within one year but in no case later than two years.” 

There is no scientific basis for this time limit. Opioid dependence changes brain chemistry in ways that take many years to reverse, not just one or two. A recent cohort study of 32,000 US veterans that tracked treatment durations of up to six years found that survival kept improving with each additional year on treatment, and that the commonly recommended six-month minimum was “likely insufficient, regardless of the patient’s individual mortality risk.”

As one review put it, the question isn’t how to get patients off medication; it’s why we’d want to when they’re already doing well on it. This is why the WHO, since 2009, has recommended that “in most cases, treatment will be required in the long term or even throughout life,” and that this “should not be seen as a failure, but rather as a cost-effective way of prolonging and improving the quality of life.”

And yet, as recently as 2022, newspaper articles ran with headlines like “Punjab’s OOAT6 plan goes awry, addicts get hooked on treatment pills!” In 2023, Punjab’s health minister complained that despite improving access to medications, there weren’t enough patients who had been “cured” of opioid use disorder. But this is a fundamental misunderstanding of opioid use disorders. It is like asking for a cure for diabetes or hypertension. For opioid use disorder, cure is possible, but unlikely; consistent, managed treatment works for nearly all patients. 

Embedding OAT within the HIV program was, in part, a way to borrow the institutional legitimacy and international funding that HIV treatment provided. This was a pragmatic choice; few would argue against reducing HIV infections. But there were significant tradeoffs. Because OAT was built as an HIV prevention tool, the program of the National AIDS Control Organisation (NACO) only registers patients who inject drugs. But this leaves out almost 90% of those who could benefit from OAT. The other 7 million people smoke or “chase” heroin, drink opioid concoctions, or take pills — and they can’t access NACO-affiliated treatment centers.

Where do non-injecting opioid users go instead? Government de-addiction centers offer short-term inpatient detoxification: patients are stabilized, withdrawn from opioids over days or weeks, and then discharged. But relapse rates after opioid detoxification are as high as 90%, with most patients relapsing within weeks of discharge. This is because detoxification only clears the drug from the body. It doesn’t undo what months or years of opioid use have done to the brain. Long after withdrawal, cravings persist, the ability to feel normal pleasure doesn’t return immediately, and the body continues to be sensitive to stress.

Worse still, patients are at high risk of overdose after detox. During detox, opioid tolerance drops sharply. When patients relapse, and most do, they return to doses their bodies can no longer handle.

Recently, India has begun to include non-injection opioid users in their treatment plans. Drug treatment clinics have been set up in government hospitals to provide OAT to anyone with opioid use disorder, not only those who inject. But by 2019, there were only 27 such clinics across the whole country. Clearly, this does not suffice to serve 7 million patients.

Punjab is the one place in India where this approach has been scaled.7 Government-run outpatient clinics now accept any opioid-dependent patient regardless of injection status. 

Evidence-Based Policymaking

There is another significant problem. Indian policymakers haven’t faced the scale of the crisis. The government’s programmatic mapping exercise, conducted between 2020 and 2022, estimated there were about 289,000 injection drug users in India. But the Magnitude of Substance Use in India study, conducted by the All India Institute of Medical Sciences (AIIMS) and the Ministry of Social Justice and Empowerment in 2018 put the number at about 850,000. The latter number is likely more accurate as it is designed to capture hidden populations away from obvious hotspots.

Different parts of the Indian government use each figure; the Narcotics Control Bureau has since adopted the higher figure, but the National AIDS Control Organisation, which runs the OAT programs, uses the lower one. Planning for the lower number will leave half a million injection drug users out in the cold, and it certainly leaves no spare capacity to reach other types of opioid users.

Even if there were only 289,000 opioid users, India simply doesn’t have the clinics it needs. In the decade to 2023, the country went from essentially zero national OAT coverage to 393 centers. Punjab has added a further 529 clinics. But just short of a thousand clinics can hardly cover 7 million people across 28 states.

The situation for women is particularly bleak. Women who undergo treatment in women-only centers show less substance use and criminal activity compared to those in mixed-gender programs, but there are only four women-only drug de-addiction centers in the entire country.

There are viable solutions to this dearth of treatment facilities. If community health centers and primary care physicians could prescribe and dispense OAT, the number of access points would increase dramatically without the need to create new centers. As of 2023, India already had over 30,000 primary health centers and about 170,000 sub-centers. Even a small fraction of these offering OAT would radically increase coverage.8

Beyond Government Clinics

In a country the size of India, though, government-affiliated clinics probably won’t be enough. Private providers can help fill this gap. This is relatively common across countries that provide OAT; Iran, for instance, has more than 7,000 private outpatient clinics dispensing OAT.

In principle, Indian psychiatrists could follow Iran’s example. There are private de-addiction centers in India, and private psychiatrists are legally permitted to prescribe buprenorphine. In practice, very few facilities offer OAT because private psychiatrists simply don’t want to take the risk.

Prescribing buprenorphine is a regulatory grey zone, with conflicting directives. Buprenorphine is simultaneously regulated under four different legal instruments: the Narcotic Drugs and Psychotropic Substances Act 1985, the Drugs and Cosmetics Act 1940, the Mental Healthcare Act 2017, and separate Drug Controller General of India approval conditions, and none of these agree on who can stock, dispense, or prescribe the drug. In the past, psychiatrists have been arrested for providing buprenorphine without the right licenses.

Consider (again) the example of Punjab. While it has had success in expanding government-affiliated clinics, private clinic expansion has not gone so well. In 2019, the Drug Controller General of India issued a directive that private psychiatrists could dispense buprenorphine from their own clinics. But, before the rules could take effect, the Punjab and Haryana High Court stayed the change. In 2020, the state’s cabinet amended its rules to allow private clinics to dispense anyway, but, by 2021, that provision had been rescinded. Four years later, in June 2025, citing the shortage in the public system, the Punjab health minister announced that private psychiatrists would be allowed to dispense in their outpatient departments. But, within weeks, the 2019 stay resurfaced as a legal barrier, and the health department set up a committee to decide how to get it vacated. In October 2025, the state cabinet issued new rules that specifically allowed individual psychiatrists to provide OAT without running a full inpatient rehab, but, within weeks, a public interest petition was filed challenging the rules. The petitioner argued the outpatient-only category was inconsistent with the Mental Healthcare Act and would encourage unregulated dispensing and diversion. At the time of writing, the matter was pending before the Punjab and Haryana High Court.

Unsurprisingly, all this flip-flopping has put private practitioners off OAT entirely. No official count of private facilities has ever been published, but the number appears negligible. In India, prescribing OAT may be harder than prescribing the opioid itself.

A Dosage That Causes Suffering

Even if a patient can reach one of the few government-affiliated clinics, the current system makes it difficult for them to stay in treatment. For a start, clinics radically underdose patients.

India’s early experiments with buprenorphine in the 1990s used very low doses of 1.2 to 2 mg per day, in part because only 0.2 mg tablets were available at the time. After larger doses became available in the 2000s, a very small-scale local study in India compared the efficacy of 2 mg and 4 mg doses. It showed no difference in efficacy, likely because the study only had 23 patients. Indian policymakers stuck with the lower, cheaper dose.

Unfortunately, early studies were misleading. The WHO now recommends 8 mg to 24 mg per day for buprenorphine maintenance. At lower doses, patients are much more likely to still experience withdrawal and cravings. Since patients still suffer the negative side effects of coming off drugs, they are much more likely to discontinue treatment. A meta-analysis found that patients on 16 mg or more stayed in treatment longer and tested clean more often than those on lower doses.

India has since updated its guidelines somewhat, but they remain far below international norms. More than three-quarters of patients at government-affiliated treatment centers were receiving less than 8 mg daily and, as a consequence, about 38% had dropped out by six months. There has been no attempt to see whether higher doses could reduce this dismal retention rate.

Increasing the dosage received at clinics to the WHO standard would not require major changes. Since dosing is centralized in a relatively small number of clinics, it would be relatively simple to require these government-affiliated clinics to provide at least 16 mg of buprenorphine daily in consultation with the patient. Since buprenorphine is so cheap, it would not even be a major strain on government budgets.

Barriers to Staying in Treatment

But let us say a patient can get to a clinic and tolerate the ongoing cravings. India’s clinics still make it difficult to stay in treatment. Indeed, they give patients a seemingly never-ending series of obstacles.

When a patient starts OAT, the consent form requires a family member or witness to co-sign, and patients must agree to bring family along for follow-up visits. At many centers, this means a patient cannot begin treatment without first disclosing their addiction to a relative. Given the severe stigma of opioid addiction, that is not a small ask.

The family obligation doesn’t stop at registration. On weekends, when clinics are closed, a family member must collect the patient’s doses and supervise them at home. The patient cannot take the medication unattended. The logic behind this is that families support recovery and that involving them early builds a structure around the patient. But not everyone has a willing family member, particularly if they have struggled with opioid addiction that has strained family relationships.

The logistical difficulties do not end there. In India, OAT requires daily attendance at a clinic. Medication is given as a small tablet, often crushed and placed under the tongue. Staff watch it dissolve so it can’t be pocketed and carried out. But most clinics are only open from 9 am to 4 pm. When travel to and from a clinic is included, treatment can take hours a day, and most of those hours must be during the workday. In a country where many laborers work in informal jobs without the ability to even discuss taking time off, it can seem easier to discontinue treatment than to try to manage the logistics.

Seasonal migration makes these constraints even harder to navigate. In India, it is estimated that between 2% and 6.8% of people migrate seasonally. But when clinics require frequent in-person attendance, OAT becomes difficult to sustain. In a set of interviews with young people who inject drugs in the northeast state of Mizoram, one patient described the problem:

“We went to my wife’s village. We expected the length of our stay to be one week, one week and a bit. But they could not give us too many OATs. Maybe it was two or three days’ dose; they gave us just that. During that time, if I didn’t take it, I still had to suffer.”

So, people adapt. For travel, they borrow doses from others at the clinic, then smuggle out their own daily allotment after they return to repay the loan. In Punjab, researchers have documented this barter system among truck drivers whose trips can last a month. Most of the “diverted” buprenorphine is probably consumed by people already in treatment, not by new users chasing a high.

In many countries, take-home OAT is much more common because they have adopted an important technological improvement. Rather than using just buprenorphine, they use buprenorphine combined with naloxone. In this formulation, an opioid-like molecule, buprenorphine, and its antagonist, naloxone, are combined. When you swallow the tablet, naloxone is poorly absorbed and has little or no effect, while the buprenorphine works as expected. But if someone dissolves and injects the tablet to get high, the naloxone blocks the opioid receptors and triggers withdrawal symptoms. This means it is safe for take-home dosing since the patient can’t get high on it even if they try.

The combination works well elsewhere. In the United States, buprenorphine is prescribed like any other Schedule III medication, with patients receiving up to a month’s supply at a time. The longer patients stay on treatment, the better the outcomes. We know that the combination product—buprenorphine mixed with naloxone—is as effective as buprenorphine alone, suppressing withdrawal and cravings. 

While there have been concerns that the effects of naloxone may be too short-lived to prevent diversion in all forms, there is some concrete evidence that its design to deter abuse works. Patients prescribed buprenorphine-naloxone consistently report injecting it for misuse less often than those on plain buprenorphine. Weekly injection rates in Australia ran roughly half those of buprenorphine alone, daily injection rates among Finnish needle-exchange participants about a fifth, and US surveillance data show a similar gap.

This combination does exist in India. The buprenorphine-naloxone combination was launched in the country in 2004-2005. It is not clear why it hasn’t become the standard medication of choice for take-home dosing.9

But during the COVID-19 pandemic, India experimented with longer dosing. NACO allowed take-home buprenorphine for the first time, with centers dispensing at least seven days’ supply, and even up to four weeks’ provision in some tertiary centers. A retrospective cohort study at one North Indian tertiary center compared patients given a 1- to 2-week supply before the pandemic with a cohort given up to 4 weeks during it. The longer-prescription group stayed in treatment longer.

But even the combination therapy is just a better version of the same daily pill. The science has moved further along. In April 2026, the WHO added long-acting injectable buprenorphine to its treatment guidelines, recognizing that a monthly injection eliminates the need for daily clinic visits that drive patients out of treatment, and removes the diversion risk that drives daily dispensing recommendations. And even better options are on the horizon: subdermal implants could offer six months of steady medication from a single procedure, and early research on GLP-110 receptor agonists like semaglutide suggests they may reduce opioid cravings. Trials are in progress in the US right now, but there are no such trials in India. India must move beyond 1990s science and find the best ways to treat its large opioid-dependent population.

Fixing the Problem

It is not that India lacks the medicine or the money to treat opioid addiction. Rather, it is that the country’s opioid treatment system was built on a deep mistrust of the people within it. Patients are treated like addicts without the willpower to get clean, not as people dealing with a physiological dependence. Every choice in the system underlines that reducing the risk of misuse outweighs any suffering patients may experience along the way.

Sankey diagram of accessing OAT in India
Sources: Ambekar A et al. on behalf of the group of investigators for the National Survey on Extent and Pattern of Substance Use in India (2019); NACO program data; Ganapathi et al. (2023)

Most of these choices can be unwound, and most without much money. India can plan for all those who are dependent on opioids, not just the ones the government deems acceptable to count; raise government clinic dosing to the WHO range; make buprenorphine-naloxone the default take-home medication; and let primary health centers and private clinics prescribe and dispense without putting themselves in legal jeopardy.

None of these require inventing anything. The evidence base is decades old, the international playbook has been successfully followed in many other countries, and India is well-placed to implement a better system. Indian patients should not need to suffer any longer.

Cartoon of opioid users being rescued by helicopters - but there aren't enough ladders or helicopters to help everyone.

Akshay Narayanan is a public health researcher and consultant working on treatment for young people with opioid use disorders in India and violence prevention in schools across low- and middle-income countries. He previously led child protection programs for Guardians of Dreams, and writes about how young people shape the world and how the world shapes their lives.

If you have comments on this article, or wish to contribute to the discussion, please email them to letters@indevelopmentmag.com. Responses will be featured in a letters section.

  1. As calculated from prevalence numbers from the World Drug Report 2025. Some sources have the US as having a slightly higher number of people with opioid use disorder; given the difficulty surveying this population, there is some variation among sources. ↩︎
  2. This cost-effectiveness estimate is from the US; no similar estimate exists in the South Asian context, despite nearly two decades of OAT delivery in India. ↩︎
  3. India’s National Crime Records Bureau reported about 3,000 drug-related deaths between 2019 and 2023 but this figure is universally regarded as a severe undercount. As Singh and Rao (2012) note, opioid overdose deaths in India are routinely registered as “cause unknown” or as exposure to cold or heat, particularly among the homeless. The figure also captures only “accidental” opioid overdose. It excludes the far larger toll of drug-attributable mortality from HIV and Hepatitis C transmission through shared needles, injection-related infections, and mental health comorbidities. The true baseline against which any treatment scale-up would operate is almost certainly an order of magnitude higher than the official count.

    Scaling OAT from 2% to 25% would put an additional approximately 1.77 million Indians into treatment. Of those, baseline annual mortality would be about 18,000 to 27,000. Applying Sordo’s 55% reduction in all-cause mortality only to the fraction meaningfully retained in treatment (assume even half, given conservative retention rates) yields roughly 4,900 to 7,300 lives saved per year from mortality reduction alone. ↩︎
  4. Some heroin users inject, although in India it is more common for heroin to be smoked. ↩︎
  5. As of December 2022, Vietnam had 235,314 registered drug users, of whom 84.7% use opioids. There are 52,000 people in treatment, which is about 25%. ↩︎
  6. Outpatient Opioid Assisted Treatment. ↩︎
  7. There are now 529 such clinics in Punjab. ↩︎
  8. Indeed, this is precisely how Punjab has been expanding access to OAT to address its growing opioid crisis. ↩︎
  9. Perhaps it is because the NACO guidelines reference only plain buprenorphine. Given the legal uncertainties, it does not make sense for prescribers to push for something not explicitly covered by regulation. ↩︎
  10. Glucagon-like peptide-1 ↩︎

What happens when 55 countries try to review medicines together?

The Problem of Regulatory Delay

The drug tenofovir disoproxil fumarate, a cornerstone of HIV treatment, was approved by the United States Food and Drug Administration in 2001. Its better safety profile quickly made it a standard treatment in the US and Europe. It should have been a shoo-in in Africa; at the end of 2001, sub-Saharan Africa accounted for over 70% of the world’s HIV/AIDS cases, while an estimated 2.3 million people on the continent died of the disease that year.

Instead, when African countries began rolling out their national programs to address the AIDS epidemic, with Botswana leading the way in 2002, most patients started on stavudine-based regimens.1 Stavudine was cheap but toxic, causing disfiguring and sometimes life-threatening side effects. In South Africa, one study showed that 30% of patients stopped taking it within three years.

By early 2006, the manufacturer, Gilead, had registered it in only five sub-Saharan African countries. Even in South Africa, one of the region’s larger markets, the company did not apply for registration until late 2005.

In Africa, programs only began replacing stavudine with tenofovir in around 2010.2 Had Gilead filed in African markets alongside the FDA, tenofovir could have been available from the start.3

This same pattern was repeated with bedaquiline, the first new class of tuberculosis drug in over 40 years. Following fast-track approvals by the FDA in 2012 and the European Medicines Agency in 2014, it was hailed as a breakthrough against drug-resistant tuberculosis, a disease that was killing over a million people annually. Most of those people lived in Africa and Southeast Asia. Yet, by October 2014, it had been registered in just one African country (South Africa). In South Africa, mortality among drug-resistant TB patients was roughly half on bedaquiline-based regimens compared to standard treatment. Elsewhere, patients continued to receive inferior drugs.4

The Nature of Regulatory Delay

On average, in sub-Saharan Africa, there is a gap of four to seven years between a drug or vaccine’s first submission to a regulatory agency in a high-income country and its approval. Two distinct regulatory barriers drive this.

The first is submission delay. Africa has 55 countries, and manufacturers must usually file separately in each one. This means repeated applications, different technical requirements, and higher costs. For firms weighing returns in any single market, the arithmetic often does not favor registration. They focus on larger, richer markets instead, so products are either not submitted or arrive years later. That was tenofovir’s fate.

The second is review delay. For example, if you submit a drug for review in Botswana, realistically, you can’t expect to start selling it until three years later. This is much longer than in countries like the US, where a standard review takes 10 months.

Drug reviews can be slow anywhere; the FDA, for instance, missed its own review deadlines for about 1 in 10 products in 2025. However, in developing countries, insufficient staffing at the regulatory agency can be a binding constraint. Reviewing a complex drug dossier requires trained pharmacologists, toxicologists, and clinical experts, as well as laboratory capacity to test product samples and systems to track adverse events once drugs reach patients. Most African countries lack this infrastructure.

According to the WHO, more than 90% of African countries have minimal to no regulatory capacity. For instance, in 2022, South Sudan—a country of about 11 million people—had just 16 staff at its medicines regulatory agency (~1.5 per million residents). By contrast, the US employed about 19,700 (~56 per million residents).

Regulating “Family Style”

Africa is not the only continent with many small countries, nor is it the only one that has faced limited capacity. Regulators around the world have developed three broad responses to submission and review delays. Each has involved some form of cross-border cooperation—call it regulating “family style.”

Harmonization of regulatory requirements across agencies addresses submission delays. When regulators standardize procedures, guidelines, and technical requirements, they make it easier for manufacturers to submit in multiple countries. The International Council for Harmonization has spent decades aligning technical standards across major developed country markets, but much of Asia, Africa, and Latin America remains outside its framework.

Collaborative review goes further: regulators jointly assess applications while retaining national authority. The FDA’s Project Orbis does this for cancer drugs. Since May 2019, the US, Australia, Canada, Singapore, Switzerland, the UK, and others have conducted concurrent reviews, often issuing approvals within days of each other. But this model depends on trust, which is easier when participating agencies have similar levels of capacity.5

Reliance reduces duplication by allowing regulators to defer to trusted authorities. For example, the UK can fast-track approval of drugs already authorized in other major markets.6 The WHO Prequalification Program operates on similar principles, allowing countries to rely on WHO’s assessment rather than conducting their own full review.

However, reliance is only beneficial when the leading authority’s reviews are timely. In 2022, WHO’s full review pathways averaged about 17 months, a reminder that concentrating regulatory work in a single body amplifies the cost of that body’s failures across reliant countries.7

The deepest form of collaboration is supranational regulation. In the European Union, the EMA conducts a single scientific review, and the European Commission issues one authorization valid across all 27 member states. This only works because EU countries agreed to pool sovereignty for drug approval. Without that political foundation, the model is hard to replicate.

The East African Pilot

In 2009, the African Union established a Medicines Regulatory Harmonization initiative.8 Rather than attempting continent-wide harmonization and collaboration immediately, it decided to run a five-year pilot through one of the continent’s existing regional economic communities, soliciting proposals and then funding the most promising plan. The East African Community (EAC) won the bid. Its application was compelling: it already had a customs union and a common market in force, giving its member states genuine experience in cross-border cooperation; it comprised a small number of partner states, most of which shared a common language, culture, and infrastructure; and its national regulators had already been collaborating informally for years.

And so, in 2012, the EAC’s Medicines Regulatory Harmonization (MRH) initiative was launched, covering nearly 150 million people. The initiative targeted reducing submission and review delays by adopting two of the “family style” regulatory approaches: harmonizing requirements and speeding up review by sharing the work among national regulators, while maintaining rigorous standards.

It was not designed as a supranational regulator issuing binding approvals. Applications would be jointly assessed, but final decisions on whether to approve a product would remain at the national level. There would be no central authority for medicine approvals in East Africa.

But it did split the work across countries. A product application was first submitted to Tanzania’s regulatory agency, which was responsible for the initial screening to confirm that all sections were complete. Tanzania then assigned two other national authorities to evaluate the application’s data in full, while Uganda’s regulator simultaneously led the product’s Good Manufacturing Practice assessment. Once these assessments were complete, all EAC regulators came together in a joint session to discuss the findings and reach a consensus recommendation. This was then submitted to the Secretariat, and the manufacturer could use it to apply for national marketing approval in each EAC member state individually.

Process map and milestones for East African Community (EAC) joint assessment procedure pilot. Source: Ngum (2025).

And it worked. Up to a point.

The median timeline for joint assessment fell from about two years to just over a year by 2017, and down to 240 days by 2019. Between 2015 and 2020, the initiative held 10 joint assessment sessions, reviewing 83 product applications, and recommending 36 products for approval in the region. The initiative also succeeded in advancing regulatory harmonization, by developing a Common Technical Document that manufacturers could use for submissions across all partner states. Joint Good Manufacturing Practice inspections began in 2016, pooling expertise and reducing redundant factory visits.

As well as reducing regulatory delay, the joint assessments introduced higher manufacturing standards than many national pathways required. They mandated bioequivalence studies, to demonstrate that generic drugs perform in the body in the same way as branded originals do. National procedures often waived such requirements, but the MRH had the capacity to insist on these.

Beyond speeding up review times, the initiative also sought to encourage drug classes that might not otherwise have been registered. Major global health organizations, such as the WHO, naturally prioritize advancing medical products to fight the highest burden diseases in Africa. These are usually infectious diseases. But as the African population ages, and the burden from infectious diseases has been reduced, non-communicable diseases have become increasingly important. The East African pilot decided to also focus on drug classes that treat these disease types, particularly anticancer and antihypertensive medicines. Before the pilot, such drugs were systematically under-registered: when Kenya’s government attempted to procure essential cancer drugs, nearly a quarter weren’t available in the country. Early joint assessment application data suggests the pilot began to address this gap: between 2015 and 2017, 16% of 49 applications were for oncology drugs and 24% for cardiovascular products.

Perhaps most importantly, the initiative helped build regulatory capacity across the region. When it began, only Kenya, Tanzania, and Uganda had regulatory agencies separate from their ministries of health; Burundi, Rwanda, and Zanzibar, by contrast, had small departments housed within theirs. By cooperating with more established regulators, Rwanda and Zanzibar were able to increase their independence.

But the limitations were equally apparent.

In 2015, Roche used the initiative to seek approval for two established cancer medicines, bevacizumab and trastuzumab.9 The joint assessment proceeded quickly, with a positive recommendation issued within months of submission. Tanzania registered them within four months of the drugs’ application for joint assessment, a remarkable improvement over its 15-month average.

Yet Roche registered the medicines in only only three of the six countries under the initiative at the time. It chose not to pursue the smaller markets. Even with a streamlined process, manufacturers still faced separate national submissions and fees; these markets simply weren’t worth it for Roche.

And the program didn’t fix all regulatory issues. National registration was supposed to take about three months, but sometimes took over a year. When pharmaceutical executives were surveyed about the initiative, their response was measured. They supported its ambitions and noted progress. But final national authorizations still took too long, and some countries failed to recognize joint recommendations.

This last point revealed a deeper tension. The premise of collaborative review is mutual trust. But some national regulators refused to accept the joint decisions. While their rationale isn’t publicly known, it could have been due to a lack of trust. When sharing work across countries with very different capacity levels, those with high capacity may not wish to defer to those with lower capacity.

The introduction of higher standards for generics created its own pressures. During the pilot, the industry became frustrated that the joint regional standards were higher than those previously applied in some member countries. As long as some countries maintain less demanding requirements, regulatory arbitrage—where firms capitalize on regulatory loopholes to avoid unfavorable rules and cut compliance costs—becomes possible, and companies may simply choose to submit only to countries with lower standards.

And there was one other issue. The initiative was meant to become self-sufficient after five years, transitioning from donor funding to fees and contributions from partner states. Nine years later, that transition hasn’t happened. Relying on outside funding introduced more delays to the process, and made the whole endeavor fragile.

Scaling to a Continent

Still, the East African pilot was always intended to lead to something larger. Conversations about a continental regulator date back to 2009, but it took a decade of political negotiation before the African Union formally adopted a treaty establishing the African Medicines Agency (AMA). Scaling the harmonization model to 55 countries had the potential for the same gains seen in East Africa, but it also meant confronting the same obstacles, compounded across a far larger and more diverse region.

Even after treaty adoption, creating the AMA wasn’t easy. In 2020, not long after the agency was created, the continent faced the COVID-19 pandemic. Most African countries lacked sufficient regulatory capacity to handle the approval of new medications and therapies. Instead, they had to depend on authorizations from the FDA, EMA, and WHO, leaving them with little autonomy over which vaccines and treatments they could access—or when. For proponents of the AMA, it was a concrete illustration of what a continental regulator was meant to address. Well-resourced regulators can supplement domestic capacity, but they cannot substitute for it. The AMA is intended as a coordination mechanism designed and governed by African states themselves, rather than relying indefinitely on external authorities. In that sense, the AMA fits within a broader African Union commitment to improve medical capacity on the continent and achieve health sovereignty.10

By the time the AMA officially launched in November 2025, some 39 member states had signed or ratified the treaty. But 16 countries, including South Africa and Nigeria, two of the continent’s largest pharmaceutical markets, had yet to commit, preferring to maintain independent regulatory frameworks. Without them, the AMA is likely to face considerable headwinds, operating with a meaningfully smaller share of total African pharmaceutical trade and a much weaker incentive for companies to engage with the agency at all.

The AMA also faces another significant hurdle. It is a harmonization initiative; it is not a supranational regulator—at least for now. Participation is voluntary, and countries retain the right to disregard its assessments entirely. Despite frequent comparisons, it is not “an EMA for Africa.” If engaging with the AMA and the individual countries costs more time and money than simply submitting to a country directly, companies will take the simpler path. If that isn’t the AMA, the agency risks becoming regulatory theater, significant on paper but inconsequential in practice.

The AMA can draw a clear lesson here from the East African pilot. An industry survey found that most manufacturers had expected joint assessment decisions to be automatically accepted by individual national regulatory authorities. Manufacturers who had expected automatic acceptance lost confidence in the program when they realized that this was not what it did. Setting expectations at the outset and clearly communicating the actual benefits of the AMA will position the continental agency far better with manufacturers than the pilot did.

As with the pilot, financing will also be a pressing question. Since 2022, the AMA has attracted significant external financial support—100 million euros over five years from the EU and the Gates Foundation, alongside contributions from Wellcome, the European Commission, and Belgium. But donor funding has expiration dates. The agency will ultimately require either substantial contributions from member states or it must begin to charge drug manufacturers.11

In many ways, the AMA will take all the challenges experienced in the pilot and amp them up. Building trust was difficult enough across countries in East Africa; it will be all the harder across the entire continent. Even the question of language becomes a serious operational problem: the EAC operates across three languages while the African Union officially recognizes six.12

If it goes well, the AMA could become a trusted coordinator that reduces duplication and accelerates access across the continent. Or, if these tensions aren’t resolved, it could become just another layer of bureaucracy, adding assessments, fees, and complexity without shortening national approval timelines.

Which outcome prevails will depend on whether the AMA can deliver value that justifies the additional step, and whether enough member states have the political will to let it try.

A Worthy Experiment

In many ways, the AMA is more than an experiment in drug regulation. It is an experiment in regional cooperation in the developing world—an experiment in which the stakes are high, resources are scarce, and incentives push toward yet more fragmentation.

The AMA is attempting something genuinely ambitious: regulatory coordination across 1.5 billion people, 55 member states, six languages, and enormous variation in capacity and political will. The EMA took decades to reach its current form, even with the advantage of operating within high-income Europe. Africa has neither time nor the advantages of money. The work will be technical, administrative, and often dull (to all but the most passionate regulatory wonks). But the alternative to a project like the AMA is that essential HIV treatments arrive half a decade late in places that needed them most.

Enlli McAleese is a researcher and advisor focused on strengthening medicines regulatory systems in Africa. She previously served as Regulatory Director at 1Day Sooner and worked on the COVID-19 vaccine rollout at the UK Department of Health & Social Care.

If you have comments on this article, or wish to contribute to the discussion, please email them to letters@indevelopmentmag.com. Responses will be featured in a letters section.

  1. Before the adoption of tenofovir in Africa, first-line antiretroviral therapy primarily relied on older nucleoside reverse transcriptase inhibitors combined with either a non-nucleoside reverse transcriptase inhibitor or a protease inhibitor. Common first-line regimens were stavudine, lamivudine, plus either nevirapine or efavirenz. ↩︎
  2. Studies have shown comparable antiviral efficacy between stavudine and tenofovir, including Gallant et al. (2004) and Kouamou et al. (2022). ↩︎
  3. It bears noting that registration alone may not have guaranteed access, since tenofovir’s price remained prohibitive until Gilead’s voluntary licensing program in 2006 enabled generic production and dramatically reduced costs. Earlier registration, however, would have created the legal precondition for faster licensing negotiations and generic entry. ↩︎
  4. Vaccines follow a slightly different path. Typically, a vaccine needs to obtain WHO prequalification before Gavi, the Vaccine Alliance, will fund it and the United Nations Children’s Fund (UNICEF) will procure it, meaning that delays at the WHO stage ripple forward and block access at scale. National registration adds a further layer, with countries in Sub-Saharan Africa taking an average of one to two years to register a vaccine even after WHO prequalification has been granted. Because Gavi’s funding decisions are tied to WHO prequalification, the WHO prequalification delays tend to have an outsized effect on access compared to any individual country’s regulatory timeline. For example, RotaTeq, Merck’s rotavirus vaccine, was approved by the FDA and the EMA in 2006 but didn’t receive WHO prequalification until 2010, leaving a four-year gap before Gavi could procure it for a disease that kills the vast majority of its victims in low-income settings. ↩︎
  5. Because of this dynamic, collaborative review has historically been used most often by countries with well-established regulatory agencies (such as countries that have WHO-Listed Authorities). ↩︎
  6. If Australia, Canada, the EU, Japan, Singapore, Switzerland, or the US has already licensed a drug, the UK’s Medicines & Healthcare products Regulatory Agency, through its International Recognition Procedure, can issue local authorization far quicker. ↩︎
  7. Ironically, this was largely due to limited resources — the same structural weakness that drives countries to outsource their reviews in the first place. ↩︎
  8. Similar efforts to strengthen regional medicines regulation are underway in other parts of the Global South. In Latin America and the Caribbean, the Pan American Network for Drug Regulatory Harmonization (PANDRH) is hosted by the Pan American Health Organization, and has facilitated regulatory harmonization and reliance since 1999, and, in 2023, the Latin American and Caribbean Medicines and Medical Devices Regulatory Agency (AMLAC) was established. In Southeast Asia, a continental agency has been discussed within the Association of Southeast Asian Nations (ASEAN). Notably, PANDRH, AMLAC and the existing ASEAN regulatory network operate as looser networks centered on harmonization and regulatory reliance rather than on centralized decision-making, and do not carry the same legal authority that the AMA derives from its founding treaty. ↩︎

  9. Approved by the FDA in 2004 and 1998, respectively, and listed by the WHO as essential medicines in 2015. ↩︎
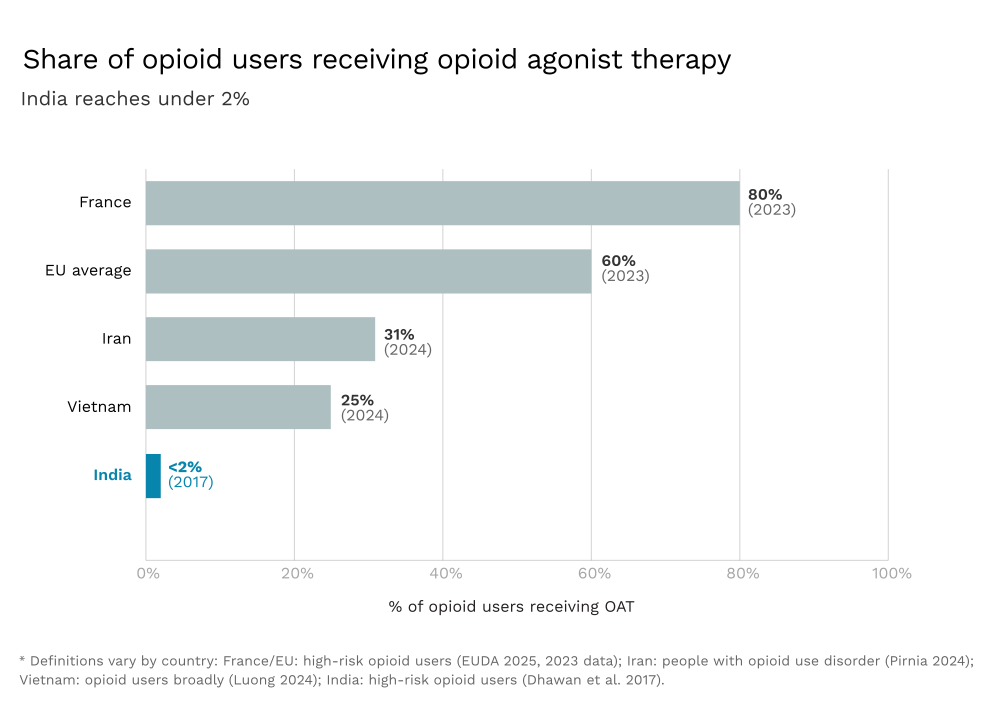
  10. This was not the first time a health crisis had spurred the creation of an African institution. Before the 2014–2016 Ebola outbreak, proposals for a continental public health body in Africa had circulated for years. African leaders had formally acknowledged the need in 2013, but with little urgency. The scale of the outbreak changed that. The African Union’s dependence on outside responders made the institutional gap impossible to ignore, and the Africa Centres for Disease Control and Prevention was established in 2017. ↩︎
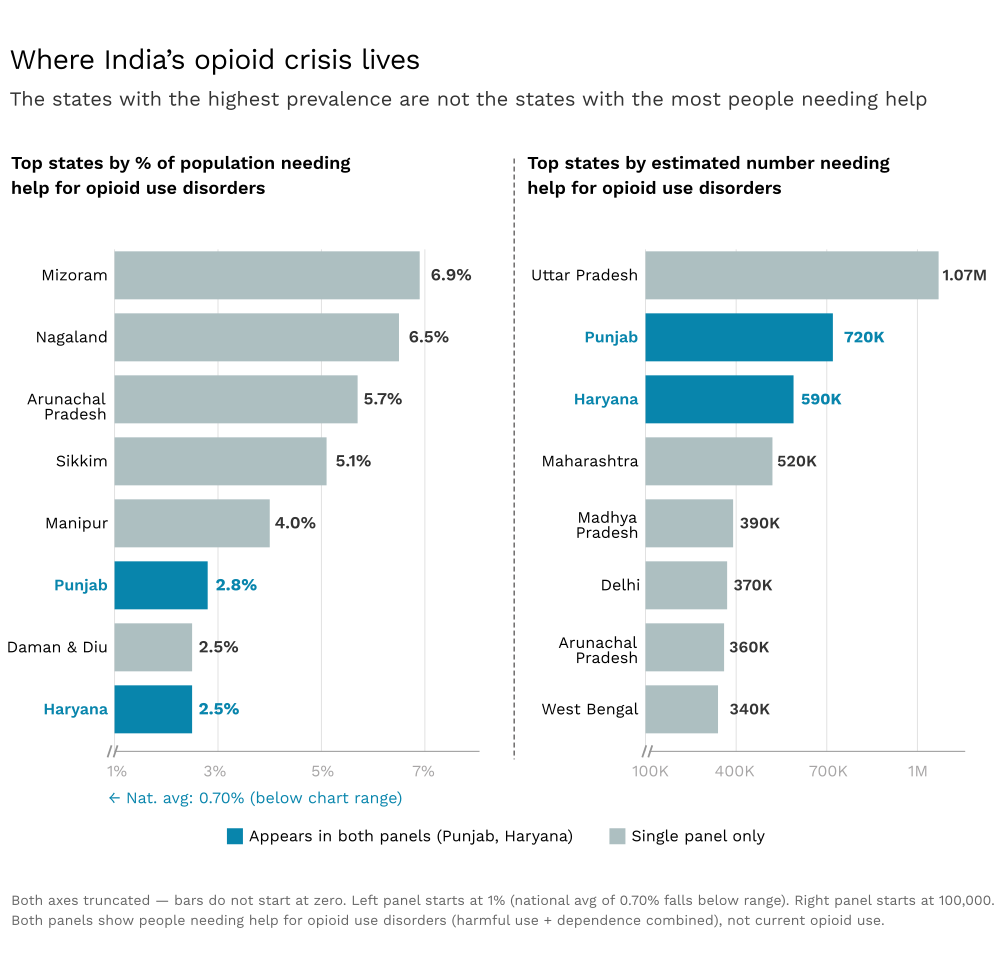
  11. This is what the EMA does, but it also offers binding approvals. Africa will need to develop its own approach. ↩︎
  12. Ask the EU about the difficulty of working in many languages. ↩︎