

In 1993, I was sitting on a mud floor with a small group of women in a village in Karnataka, trying to start a conversation about their lives.

I had a survey for them to answer: heavy on questions that required numerical answers about consumption and family structure — who lived in the household, how old they were, what they had eaten, what the roof was made of. This is standard stuff in development economics.

We were a few minutes in when the door slammed open. One woman’s husband stormed into the room, grabbed her by the hair and dragged her out, shouting that lunch wasn’t cooked and she was wasting her time with us.

I was a young economist then, with a freshly minted PhD. My questionnaire had no item for what I had just seen. We had not come to study domestic violence; we had come to collect evidence on more prosaic questions of how sociocultural and economic systems shape marriage markets and living standards.

This is a vague enough remit that, in principle, almost anything should have qualified as relevant; it should have been easy to retool and collect more data that accurately reflected women’s lives. But the survey we had brought with us — with all its inherent assumptions — was calibrated to register what could be measured cleanly and not much else. Our disciplinary training was not fit for purpose.

It took us a week of staying in that village, drinking buttermilk and coffee, sitting through many silences, before one of the women finally opened up and said: “You have become our friends and we can’t lie to you anymore. We feel like we are in jail. Our husbands beat us all the time. They spend the family money on alcohol. No one helps.” 

That was new information. We rewrote our questionnaire on the spot, added items on wife-beating, which resulted in a mixed-methods analysis of domestic violence and one of the first economics papers on the subject in a developing country.

Photo of Rao with villagers
Vijayendra Rao (in blue shirt) with team in rural Karnataka, 1993. © Vijayendra Rao

I have thought about that week for more than 30 years. Not because the story is unusual — anyone who has done serious fieldwork has a version of it — but because of what it taught me about my own discipline. I am an economist, and economics is well known for its rigor, its emphasis on quantitative methods — and its distance from its subjects. Economics tends to focus on the measurable, which can exclude what is important; if it cannot be included in a survey module, it is not worth studying. But life is about more than survey modules, and the wall between economist and subject is not a methodological convenience. It is the central problem with the discipline.

I have spent my career as a kind of spy — an economist smuggling anthropology’s methods across the wall. I have written the careful academic version of this argument. What follows is the version I would talk about over a drink.

How We Got Here

Things did not start this way. In the late 19th century, Charles Booth, a shipping magnate turned amateur sociologist, took it upon himself to find out how the poor of London actually lived. He spent 17 years on the job. His team gathered information on 4 million Londoners: school inspectors, factory owners, clergymen, policemen and many more. They did surveys, but they also did much more: they took notes, they did open-ended interviews, they made color-coded maps. Booth used both numbers and stories because his question — what does poverty look like in London? — demanded both. He and his team stitched all of it into 17 volumes of “Life and Labour of the People in London,” showing, block by block, who was wealthy and who was destitute and who was somewhere in between. This integration of both story and data shaped economic and social policy in Britain for a generation.

Over the 20th century, that integration came apart. Economics, in its push for scientific status, narrowed itself to the analysis of quantitative data. Cultural anthropology split off into the ethnographic tradition — some of it deeply insightful, and some of it consumed by critique and navel-gazing. Sociology fragmented into many parts and a spiral of internal arguments over methods. Psychology went experimental. Political science was increasingly influenced by economics both in theory and method but retained an openness towards mixing qualitative and quantitative methods. By the 1980s, the disciplines distinguished themselves from one another mainly by what they refused to look at.

In economics, there were a few attempts to bridge this gap that did not have much of an impact. Back in 1984, Pranab Bardhan organized a seminal conference on “Conversations Between Economists and Anthropologists” on data and mixed methods. In 2002, I tried to make a case for “participatory econometrics.”

Then came the credibility revolution. In an effort to make research more credible and reliable, causal inference became the lodestar of empirical economics.  This meant that economists could say with confidence that A caused B, but it also meant neglecting the types of questions that could not be answered with these tools.

I do not want to be misread. The credibility revolution is a major leap forward for the social sciences. We can now answer questions that were genuinely beyond us 30 years ago. But when the only acceptable tool is a hammer, one tends to look for questions that could use a nail. Economists tend to prefer questions that can be answered cleanly and leave aside those that cannot. In development, the consequences have been particularly stark. We can now estimate to three decimal places how a cash transfer affects a child’s height. We have almost nothing to say about how the program worked (or did not work) and we almost never hear directly from the child and their family about what they had to say about it — in their own words.

The Distance Problem

In 2002, the sociologist Michael Burawoy drew a hard line between what he called positive science and reflexive science. Positive science — which is roughly economics — insulates itself from its subjects. Data collection is standardized so it does not matter who is collecting the data. The researcher does not have to be on site; a survey firm can administer a survey as well as s/he can. The world is to be observed, not participated in. Reflexive science — ethnography, in its best form — embraces the opposite point of view. The interview is not separate from the intervention; it is part of it. The researcher is not separate from the research; rather, her presence is a key part of the process.

Burawoy thought these two ways of doing social science were so different that they could never be reconciled. I disagree, and I have spent much of my career trying to marry the twain that he argues could never meet. But he is right about one thing. The distance between researcher and researched is real, and in development economics it is stark.    

Almost everyone I know who studies poverty has never been poor. We are often from different countries, different social classes, different castes and races, often speaking different languages, from the people we write about. None of that disqualifies you from working on poverty — it would be a strange profession that insisted only the poor could study poverty — but it should give us some humility. Most development economists do not know what the lives of poor people are actually like, day in and day out.

What the discipline rewards instead is a performance of objectivity: Researchers should not influence their subjects; they should stay at arm’s length and use the same tools as everyone else. Your subjective suspicions should not contaminate your analysis. You are not a part of the subject group, and you should not be; your influence upon them would make your research less valid. 

In short: the more distance we have from those we study, the more clearly we will see them. The opposite is closer to the truth. Distance does not produce clarity; it produces the kind of clarity you get from squinting through a small circle that you have cleaned inside a dirty window. It convinces you that what you can make out from where you are standing is all there is to see.

Four Things We Could Actually Do

So what would it take? I suggest four things economics (development or otherwise) could do to limit researchers’ distance from their subjects. 

Cognitive Empathy

The sociologist Mario Small uses the phrase “cognitive empathy” to mean the ability to understand a person’s predicament as they understand it. It does not suffice to think about how you would feel if you were in their position;  you must think about it as they understand it from theirs. It is much harder than it sounds. It requires you to take seriously the possibility that your subjects’ theory of their own lives is more accurate than yours.

Some of the best development economists I know have this in spades. Jean Drèze has lived for decades in the rural India he writes about, refused funding from institutions like the World Bank that he thought would compromise his independence and successfully pushed for one of the largest rural employment guarantees in the world. Despite this, he almost never publishes qualitative analysis; his work is overwhelmingly quantitative. But every sentence is shaped by years of having actually listened. He is not alone among economists; Christopher Bliss and Nicholas Stern spent eight months in the village of Palanpur in the mid-1970s and inspired what is now a multigenerational research project.

The point is not that empathy must show up as a qualitative paragraph in the paper. Merely having done a focus group that you report in a footnote for color (and to signal your field creds) is not enough. Many economists already do this; it clearly isn’t sufficient to reduce the distance between the researcher and the researched.

It is that the work has to be shaped by it. And here is the awkward truth: Almost all of contemporary development economics is not. We design experiments based on the input of other economists. We read papers, we deliberate in seminars, we come up with new models based on economic theory rather than experience. The intervention happens through an implementing partner, and the endline survey through a survey firm. Even the analysis might be handled by a research assistant (or, now, coding agent). The result is a body of work that is technically immaculate and substantively thin. To paraphrase an old chestnut: It is an expensive way to be precisely trivial rather than vaguely right.

Narratives Are Data

People do not talk in numbers. They talk in words. They tell stories, they contradict themselves, change the subject and circle back. They forget things and remember them halfway through the next topic; they get distracted and tell you about something interesting but unrelated. Survey instruments are a kind of violence against this — useful violence, often, but violence nonetheless. Instead of the messiness of human life, you get a small number of tick boxes.  If the boxes are well designed, you get a lot of information. But you never get everything, and frequently, you will miss the most important parts.

The book “Portfolios of the Poor” is what every economist should be made to read on this point. The authors — a development economist (Jonathan Morduch), an anthropologist, a microfinance practitioner and a finance expert — gave up on standard surveys and instead visited 250 households in Bangladesh, South Africa and India at least twice a month for a year, building “financial diaries” out of long, open-ended conversations. They estimated that one-shot surveys were missing about half the financial activity of a poor household. Half. The poor were not, it turned out, simply consumption smoothing. They were trying to manage portfolios of assets under conditions of grotesque uncertainty, with very little room for error. No standard consumption survey would have shown the level of complexity in how the poor managed their households; researchers had to let households describe their finances in their own words.

I have done versions of this myself. With Paromita Sanyal, I spent 10 years analyzing transcripts of 300 village meetings in South India — what we called “oral democracy” — to understand whether poor, low-literacy, deeply unequal communities could actually deliberate in any meaningful sense. (Spoiler: They can, and the quality of that deliberation depends much more on state government policy than on the village’s literacy rate.) 

Ten years is a long time. It is also why so few economists do this kind of work. Tenure evaluation is often slower than that; investing in something that might not bear fruit until after tenure is a difficult choice for many early-career faculty. Worse yet, this kind of data does not always lead to the kind of publication that gets you tenure. My work was eventually published as a book, not a top-five journal article — a much lower-value thing when one is up for tenure. 

And until very recently, the technology to scale up the analysis of narrative data simply did not exist. The 10 years were a function of the technology of the time, not a requirement of the method. With today’s technology — recording devices, AI for transcription — collecting qualitative data is easier than ever. Embedding a few weeks of open-ended interviews in a standard RCT, reading the transcripts your survey firm’s enumerators could be collecting anyway, piggybacking on existing qualitative data — these fit inside a dissertation timeline, and the tools for scaling them are getting cheaper every year. 

The deeper point is the disciplinary reflex. Open-ended narrative is still routinely treated in economics as “anecdote” rather than data. Researchers who mix quantitative and qualitative methods are, to quote the political scientist Atul Kohli’s wonderfully insightful joke, “stuck between a rock and a soft place.” Reviewers reject them because of a perceived lack of rigor, and editors do not see the added value. 

I have had this happen to me directly. The two early papers on domestic violence I mentioned earlier — one using a combination of ethnographic and econometric methods, the other building a game-theoretic model of dowry violence and testing it with survey data — were originally a single paper. When I included qualitative methods in the paper, it was rejected from several economics journals. My co-author Francis Bloch and I gave up and split it in two — one of the resulting papers was accepted into one of the most prestigious journals in economics.

This distaste for the qualitative is one of the stranger superstitions in the discipline; there is no methodological reason a transcript is less informative than a Likert scale.

Take Process Seriously

Empirical economics, especially since the credibility revolution, has become almost monomaniacally focused on outcomes. Did the intervention work? By how much? For whom? These are good questions, but they are not the only ones. It is rare for empirical economics papers to spend much time focusing on how an outcome happened. Who said what to whom to start the process of change? Who were the early adopters, and who had to be brought along later? What did people think about the intervention? An RCT can tell you if an intervention worked; ethnography can tell you why. Mechanisms often get short shrift in empirical economics. You do your RCT, you get your result, you come up with some plausible explanations, you write up a model for how those explanations would work (if they’re right). This is fine as far as it goes, but it does not go very far.

The map of mechanisms you can construct from theory alone is a small subset of the mechanisms that actually operate in the world, and reasoning from outcomes back to mechanisms is a notoriously unreliable exercise. The alternative is to actually go, talk to people and observe.

A few years ago, colleagues and I worked on a randomized trial in rural Karnataka to test whether intensive training in participatory planning would improve village governance. The intervention assigned 50 villages to the participatory training, planning and monitoring exercise and 50 to control. Instead of just relying on a baseline and endline survey (which we also did), we did the unusual thing of embedding five trained ethnographers in matched treatment-control pairs of villages for the duration of the study. They produced 240 monthly reports over four years.
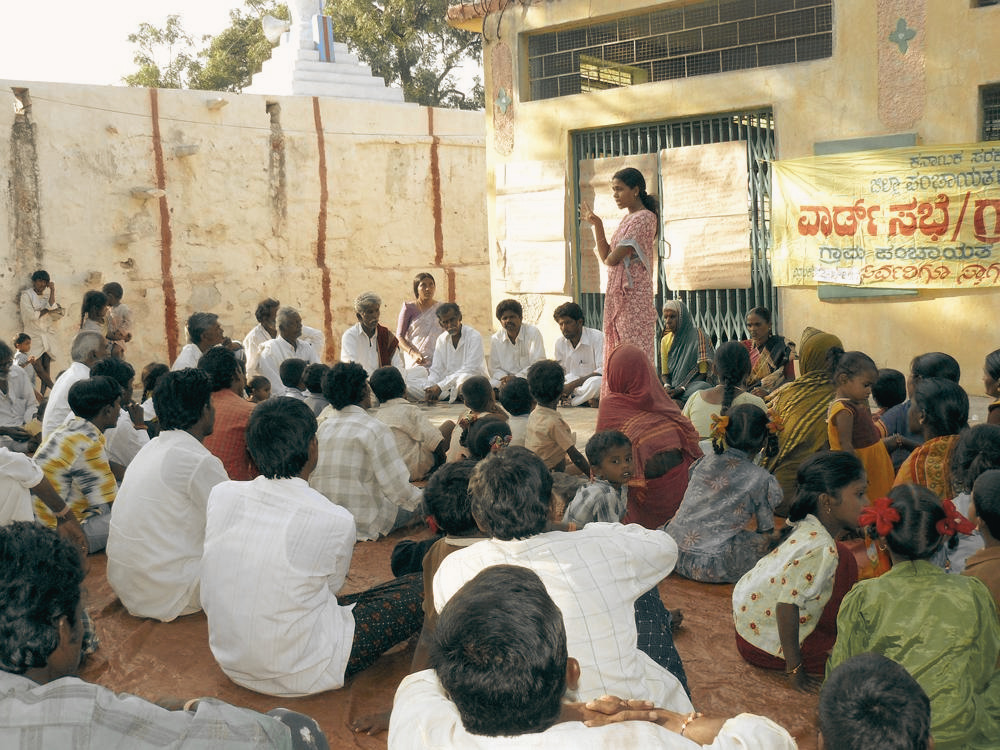
villagers discussing the study questions
Participatory planning in Raichur District, Karnataka © Vijayendra Rao

The headline result was a null. The intervention did not produce statistically significant gains over the comparison villages. In the standard economics genre, that would have been the end of the story — a disappointing null. Perhaps the paper would include a theoretical model on why participation fails, but there would be very little to learn here.

But because we had the ethnographies, we could see what actually happened: The “failure” was not a failure of the idea but of the conditions under which it was tested. The quality of implementation varied a lot: Some facilitators were excellent and some were poor. Higher officials in the government did not take the intervention seriously and frequently transferred and replaced facilitators for reasons that had nothing to do with the intervention. Persistent caste-based inequality was actively chewing through any gains the training produced. The ethnography was the core of the paper, not just the color. 
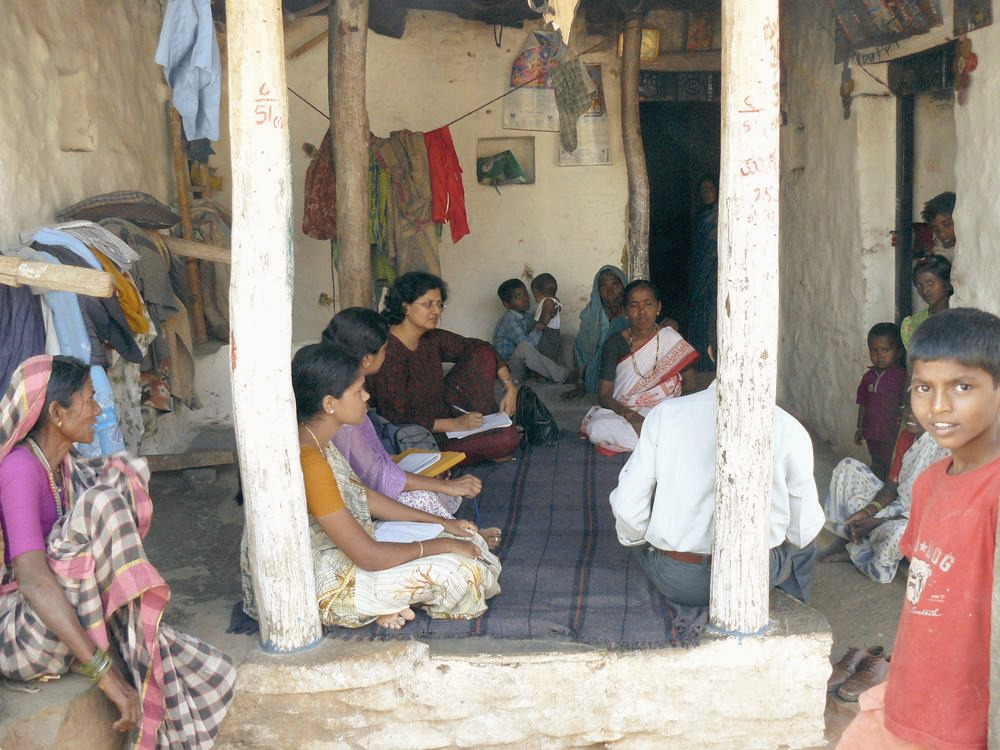
Kripa Ananthpur conducting an interview about the intervention with villagers
Kripa Ananthpur conducting an interview about the intervention. © Vijayendra Rao

Respondents as Analysts

If our purpose as researchers is to help people become better off, then the people themselves should at minimum be told what we found. Development practitioners have been talking about including those they study in the process for decades — and yet, this is rarely implemented. And reporting findings would only be step one. It would be better if they helped design what we ask. Best of all, they should be able to conduct research on their own lives without our mediation at all.

In 2014, with a group of colleagues at the World Bank, I tried this. We worked with representatives of more than 200 tribal villages in South India to co-produce a method we called participatory tracking. The villagers spent weeks deciding for themselves what counted as the good life, turned those ideas into survey questions, tested the questions in their own villages and then — using tablets and a system of video-based training — surveyed their own neighbors. In a single district, we conducted a census of 32,000 households in about six weeks. 

Only 17% of the questions overlapped with the standard Indian National Sample Survey. The villagers were asking different things because they wanted to know different things. For instance, in order to assess whether a household was poor, they devised the following question, which proved extremely effective: “Did the last person to eat in the family ever go hungry in the past week?” To a respondent this was obviously a question directed at the mother, and mothers in food-constrained households often went hungry in order to feed the adult men and children in the family. 

Literacy rates were low, so we collaborated with the villagers to produce data visualizations of the results. We iterated until people who could not read could see at a glance how their village was doing on what they cared about. The data then got used in actual village meetings. The quality of those meetings improved noticeably, because everyone was working from the same picture instead of arguing about the facts.

Instead of the usual LaTeX table, here is a visualization of marriage patterns that we co-produced.
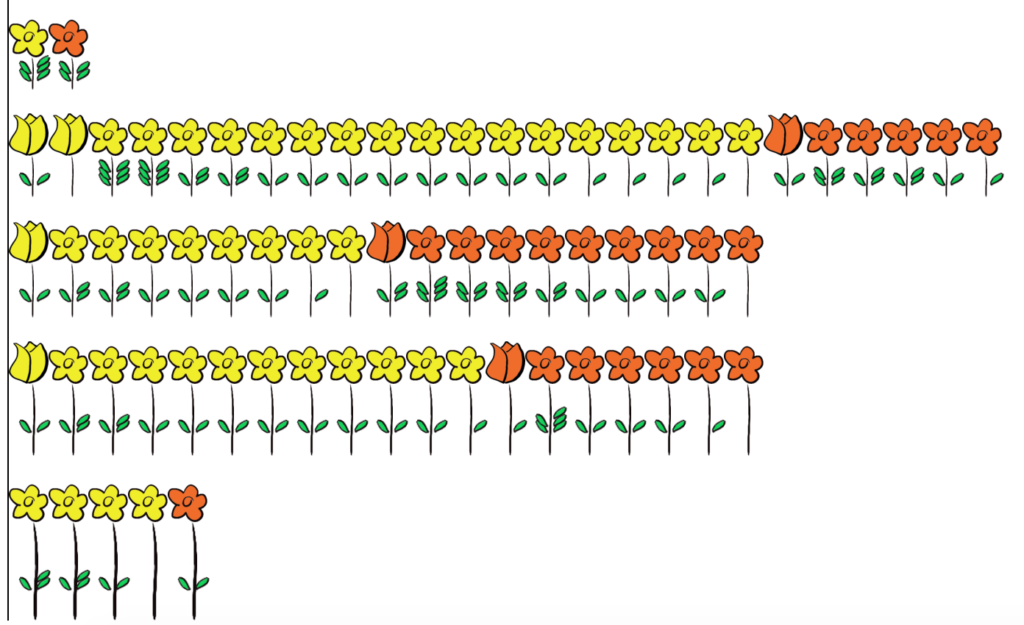
Visualization of marriages in a village

Each woman in the village is represented as a flower. The height of the flower is the age at which the woman got married. The number of leaves is the number of children resulting from the marriage. A red flower indicated that the woman had married a blood relative, and a yellow one meant that she had not. A flower bud meant that the marriage was not consensual, and a bloomed flower was consensual. The mappings between the flower’s appearance and meaning were tweaked by the women to make them more relevant to their local contexts, and therefore more intuitive. 

Some villagers who saw this visualization immediately disregarded the high proportion of red flowers they saw, as marriage within families is accepted and widely practiced. However, other communities wanted to reduce the ratio of red flowers to yellow flowers by educating future generations of women about the problems related to intra-family marriage. 
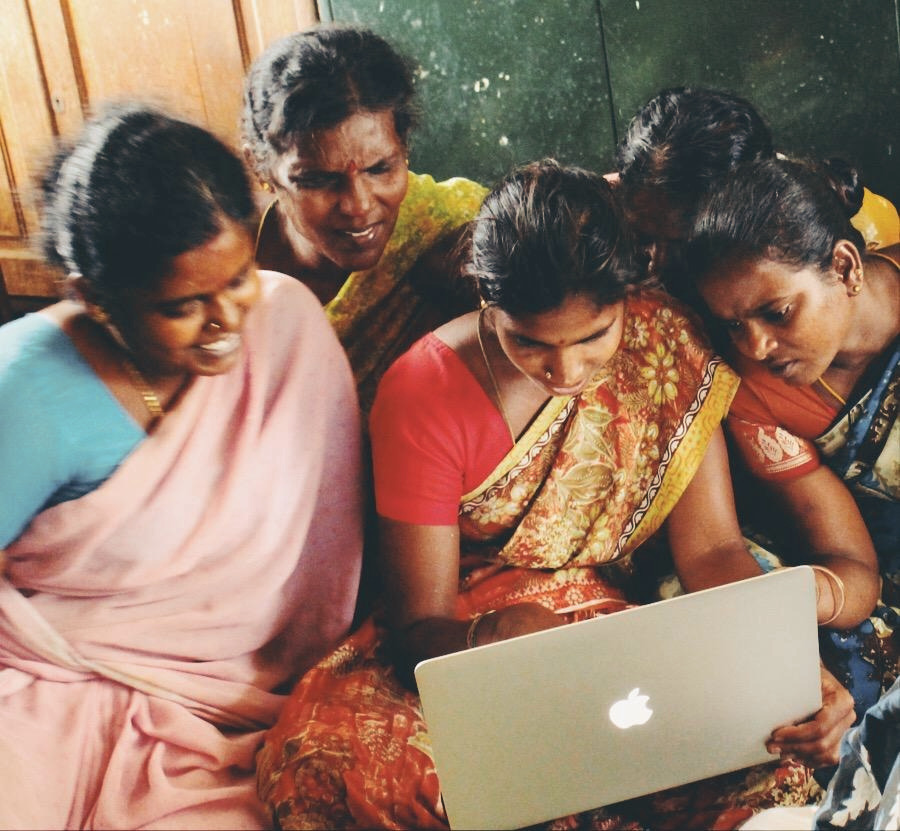
Women in Rural Tamil Nadu discussing the visualizations © Vijayendra Rao

Trust me, I know how this sounds. The rest of the field would file this experiment under “charming but unscalable.” That is a little bit true; a participatory, co-produced survey process is slower and more laborious than a standard questionnaire. We could not use a standard set of questions, because the standard set of questions wasn’t what people actually wanted to know. And the alternative was the status quo: where we would show up, ask people a bunch of questions about their lives — that they really didn’t feel were all that relevant to them anyway — and write a paper that no one surveyed would ever read. Given that, co-produced surveys seem worth the time. 

The LLM Problem

The technology for coding open-ended interview questions has also gotten much better in the last decade. Large language models are particularly adept at going through large amounts of unstructured text and pulling out themes; Claude’s current abilities would have seemed like science fiction in 2014. Now, they can essentially replace a research assistant in coding English-language text. I have used LLMs too. Some of my recent work piggybacks on a panel of Rohingya refugees and Bangladeshi hosts where we conducted long open-ended interviews with 2,000 respondents and developed a method we call iQual. It analyzed a small subsample using interpretative sociological qualitative coding and then used machine learning to scale up the codes to the full sample. This kind of project was simply not feasible before.

But using LLMs outside of Western contexts isn’t always simple. We compared our “bespoke” method to LLM-based coding and found that LLMs gave us highly biased results — possibly because they are not trained on Bengali and Rohingya dialect text. The bias of a poorly designed survey is at least legible. The bias of a frontier language model trained on the internet is not. Hopefully this is a temporary problem; with efforts in place to improve AI with under-resourced languages, LLMs will get better at this with time.

So I should be excited, and on most days I am. But I want to be careful here. It’s true that there is a version of the future in which LLMs democratize narrative analysis in the same way that calculators did for arithmetic. They are faster and cheaper and they can vastly expand who can do qualitative analysis. Unfortunately, however, I fear it is more likely that they will be used to widen the distance between researcher and respondent. If a researcher never spends time with the people they study and simply reads the LLM’s summary, there is no cognitive empathy. The LLM is the only one listening — not the researcher. My rule of thumb is that LLMs cannot substitute for a human. They can extend your reach — help you process data more quickly — but they cannot replace you. You still need to spend time in the field; you still need to talk to people about their lives and their needs. You must read the transcripts yourself; you should know the people and the context well enough to be able to tell if the LLM’s coding has gone awry. LLMs might be powerful enough to do 90% of the job — but that remaining 10% should not be automated away. Empathy is not a Claude skill.

What It Would Actually Take To Listen to Respondents

Some of this can be accomplished by individual researchers deciding to do their work differently. Quite a lot more of it requires the discipline itself to change. Right now, the professional incentives still push young scholars towards “business as usual.”

Journal editors have to stop reflexively rejecting qualitative material. Graduate programs will have to expand beyond their teaching econometrics into teaching qualitative methods as well. Hiring committees will have to start to value time spent in the field. Funders have to accept that good mixed-methods work can be expensive and slow — certainly slower than running a regression from a Cambridge office. But it will also make economics a stronger discipline. Spending time with people will produce insights that can be obtained no other way.

In the short run, I am not optimistic. Disciplines are stubborn things, and economics is more stubborn than most. It is a discipline already struggling to diversify beyond a few top programs and economics seems to be particularly prone to reproducing class hierarchies. But I am less pessimistic than I might be, because it seems things are already beginning to change.

A generation of younger development economists is more comfortable doing fieldwork than mine was. Adjacent disciplines — political science, sociology, public health — have been mixing qualitative and quantitative methods for a long time without losing their disciplinary identity.  Some of these disciplines even co-author with economists, adding depth to the rigor of an economics paper. And some funders are also starting, slowly, to ask harder questions about whose voices are represented in the work they pay for.

My argument is, fundamentally, not that complicated. If you study people, you should listen to them. This is doubly true if you study people who live lives that are very different than your own. It is on you, as the researcher, to try to close the distance between you and your subjects — building bridges instead of walls.

Thirty years ago, Robert Chambers asked an important question: “Whose reality counts?” It has still not been answered. Economics has preferred to duck the question, pretending that empirics could substitute for an answer. I do not think it should continue to do so. Indeed, I think this remains one of the most important open questions in development research.

The woman in Karnataka dragged out of our focus group by her hair was telling us something — that her reality was not captured by our questions. It took us a week to be able to hear it, and the only reason we eventually did was because we were still in the village a week later. There is no shortcut for this. 

Numbers help. So do words. But most important is sitting in the village and listening long enough, and with enough cognitive empathy, that someone tells you the truth.

Vijayendra Rao is a development economist and social scientist who combines econometric methods with ethnography. He spent 27 years as a Lead Economist in the Development Economics Research Group at the World Bank, and is currently the Roberta Buffett Distinguished Scholar-Practitioner in Residence at Northwestern University. His interests include gender, culture, participation, deliberative democracy, political economy, and innovations in mixed methods. His recent methodological work with Julian Ashwin, Monica Biradavolu, Aditya Chhabra and others uses natural language processing to analyze open-ended interviews at scale and compares it to LLM based qualitative analysis. His latest book, Revolution by Stealth: How Women’s Groups Catalyzed a Cultural Transformation in Bihar (with Shruti Majumdar and Paromita Sanyal), is forthcoming from Cambridge University Press in September 2026.

cartoon of woman with glasses with an ear instead of a lense

If you have comments on this article, or wish to contribute to the discussion, please email them to letters@indevelopmentmag.com. Responses will be featured in a letters section.


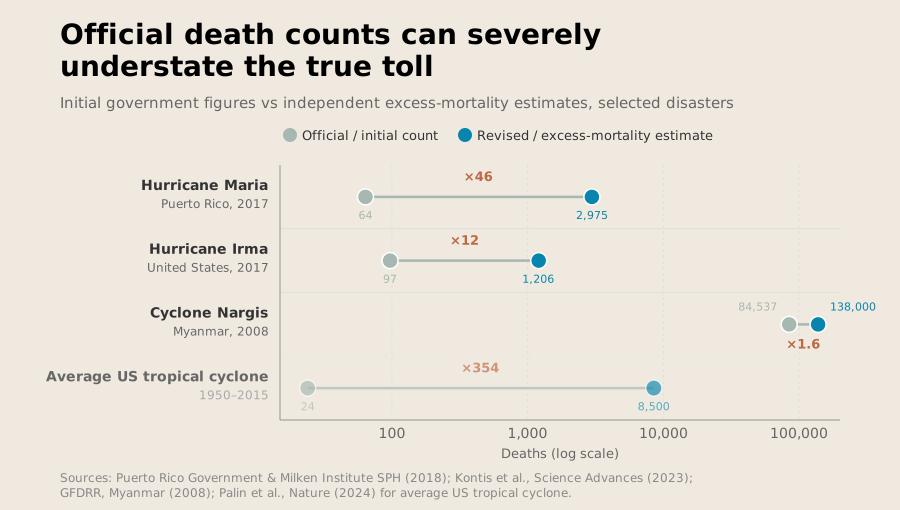
Hurricane Maria hit Puerto Rico in September 2017. In the days following the hurricane, the government reported just 64 deaths.

This number reflected only those directly killed by the hurricane — those found the next morning or soon after — and did not include the thousands who died in the weeks and months after the disaster. Maria hit the infrastructure of Puerto Rico hard: there were major power outages that shut down hospitals, medical supplies ran out and other critical infrastructure across the island collapsed. In a special assessment commissioned by the government of Puerto Rico a year later, a team of researchers revised the number of deaths after the event. The total count rose to 2,975 — 46 times higher than the original estimate. 

Satellite photo of Hurricane Maria
Hurricane Maria from satellite; image by Antti Lipponen, licensed under CC-BY.

The example of Hurricane Maria is not unique. In many countries, the databases used to track the impact of disasters can be badly wrong.

Chart showing the large differences between initial death counts and excess mortality from disasters
Across contexts, initial death counts underestimate the total death toll.

They rely mainly on government and news reports — but those are shaped by when governments choose to provide information and how these governments define what counts as disaster impact. The data isn’t just used for academic purposes; disaster figures weigh heavily in today’s world. They can influence which countries receive funding and where disaster funds are spent.

While these decisions are often framed as technical, there is a political dimension to disaster reporting. The data can often determine whose suffering is recorded and prioritized. We treat these figures as facts, but they are not. They are generated by systems, with the same fragilities as any other policy realm. Disaster data is far less reliable than its users often assume.

The criteria for good data are not controversial. Data should reflect what actually happened, capture the full picture, remain comparable across time and geography, and not count the same event twice. Unfortunately, we are far from achieving that. 

How Disaster Databases Actually Work

We need data from disasters. Recovery efforts must be planned, humanitarian assistance delivered and resilience plans made. The Emergency Events Database (EM-DAT) is the most widely used free source of global disaster data, covering both technological and natural hazards. It has records of more than 27,000 events since 1900. For an event to be included, it must meet at least one of three main criteria: 10 or more people killed; 100 or more people affected; or a declaration of a state of emergency or call for international assistance. 

While reasonable, these criteria mean the dataset has blind spots. A drought that killed nine people will typically not be included in the database, unless it triggers an emergency declaration or an international call for aid. The same occurs for a flood that affects 95 people. And there’s an important caveat there: it is focused on the number of people reported affected or killed. If the reporting isn’t accurate, neither is the database. EM-DAT requires cross-verification of each event from at least two independent sources, which are often international agencies, wire services and English-language media.

Given this, geographical bias in media reporting is likely to propagate into the EM-DAT database itself, leading it to capture more disaster events in developed economies than in less developed ones. It also lets governments manipulate the data. If the government only admits to nine deaths, the event won’t be included — even if there are far more than nine deaths in reality. This lets governments evade accountability for their actions.

Consider the 2008 Sichuan earthquake in China. Several of the hardest-hit areas were poorer counties in the region, and many buildings collapsed. The official death count was fixed at around 70,000, with a further 18,000 people still listed as missing. Parents, activists and journalists who tried to seek accountability and investigate construction codes and the collapse of buildings were targets of censorship, detention and surveillance; the full toll and responsibility, especially for the school collapses, remain difficult to verify independently. 

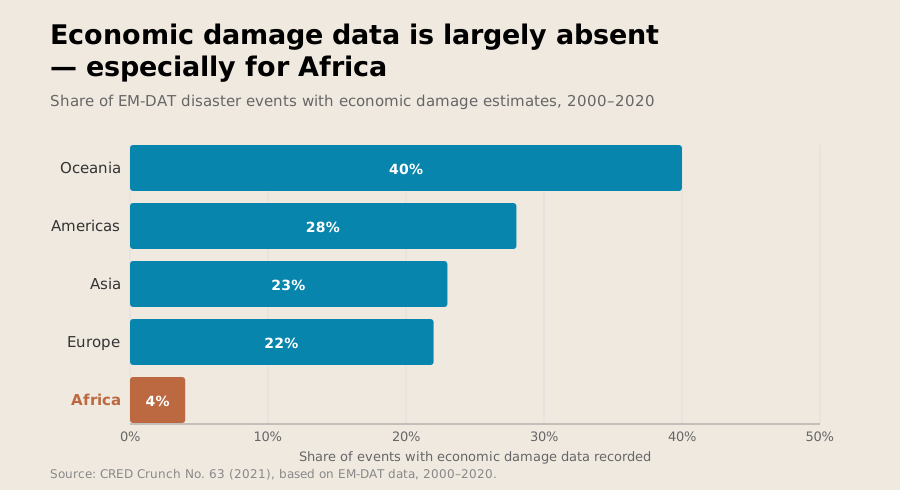
Even when an event meets the thresholds, other information may be incomplete. Information on economic losses is the main source of missingness; it is unavailable for 80% of the events recorded from 2000 to 2020. Economic damages are hard to calculate and are rarely provided in low- and middle-income countries. Just 4% of African disasters recorded in EM-DAT have economic damage estimates.

Chart showing how few disasters have economic damage estimates
While no region has complete coverage of economic damages, Africa has particularly bad coverage.

But this doesn’t stop people from using the data off-the-shelf. A growing number of highly influential and widely cited publications use this data for empirical studies with very limited acknowledgement of its problems.

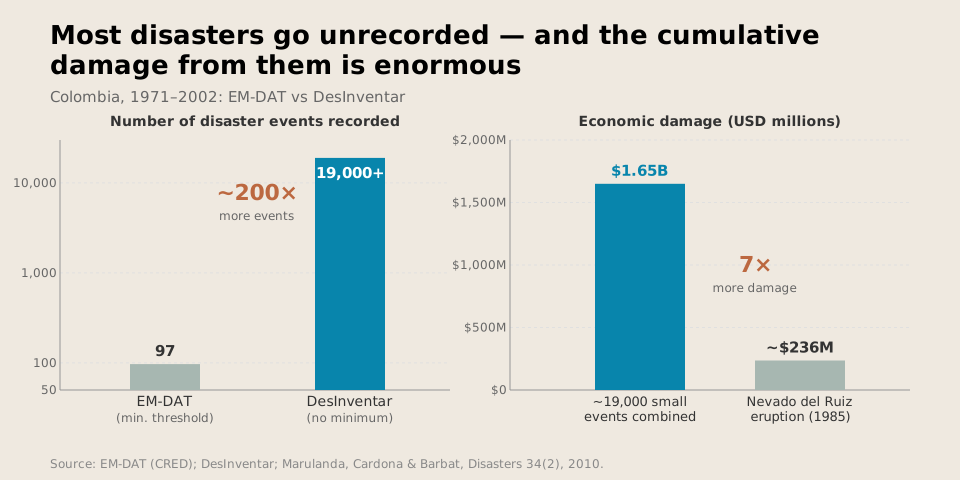
The scale of the limitations becomes clearer when you compare disaster databases. Between 1971 and 2002, EM-DAT recorded 97 disasters in Colombia. Another database, DesInventar, recorded more than 19,000 in the same period. Only a small percentage of the local events in DesInventar would meet EM-DAT’s definition of a disaster, but taken together, the “small” events in Colombia caused more than $1.65 billion in damages. This is around seven times the economic losses caused by one of Colombia’s deadliest disasters, the Nevado del Ruiz volcanic eruption. Together, these “small” events pack a big punch.

Chart showing small disasters combine to have more impact than large disasters
There are many small disasters; together, they cause as much damage as large events.

DesInventar represents a different type of disaster database. Instead of setting specific criteria for inclusion, DesInventar allows countries to freely build their own disaster inventories. In general, this means that it includes smaller disaster events, but it also means the quality of the data included within the database depends on each government’s capacity to collect and maintain records. This can vary considerably. Peru is a prime example. Its data uses a single source — and events near Lima are far better covered than events in more remote parts of the country. 

Nor is that the only discrepancy. The count of those who are “affected” can vary substantially. EM-DAT defines those affected as requiring immediate assistance, but countries have different standards for what is considered “assistance.” Some include all those in the disaster zone; others include only those who lost housing, while still others count assistance requests as the parameter. Countries might even strategically choose who counts as affected, because such data can help determine if a country qualifies for climate adaptation financing or not.

Other categories of data are even murkier. As noted, economic damage estimates are often missing and where they do exist, the data is sketchy at best. Some studies comparing disaster events between EM-DAT and DesInventar found that damage figures diverged by more than 20% in most cases.

Turning Disaster Data Into Policy

This may seem an academic concern. It is not. These databases are used in real policy decisions.

The United Nations Office for Disaster Risk Reduction uses both EM-DAT and DesInventar for its Global Assessment Reports, one of the main publications guiding international disaster policy. United Nations Member States also report their progress through the Sendai Framework Monitor, which uses disaster databases as inputs. This is then used to track progress, identify disaster-risk priorities, guide resource allocation toward risk reduction and help plan climate adaptation strategies.

Climate finance, a sector that moved $1.9 trillion in 2023 alone, also uses disaster databases to assess climate-related disaster risk. Countries often use Germanwatch’s Global Climate Risk Index to discuss the need for funding support for adaptation or losses. Germanwatch’s current index uses EM-DAT with a few caveats on its limitations. This loss and damage analysis, for instance, uses the index without discussing its data limitations.

The reliance on EM-DAT goes beyond the Global Climate Risk Index and into the operational structures that determine humanitarian funding flows. The INFORM Risk Index uses EM-DAT for a few of its hazard indicators and has been used by the United Nations Office for the Coordination of Humanitarian Affairs, the European Commission’s Civil Protection and Humanitarian Aid Operations, the World Food Programme, the United States Agency for International Development, the UN Central Emergency Response Fund and more to help prioritize and allocate humanitarian resources. Mistakes in EM-DAT could leave disasters underfunded. This might occur if many more people died than are reported in EM-DAT because their deaths were not reported in English.

In 2015, the Malawi government paid $5 million for drought insurance through the African Risk Capacity (ARC), which pays out when its model estimates that a drought has crossed a given threshold. After the 2016 El Niño drought, which left 6.5 million people in need of aid, the model initially found that no payout was warranted, based on a false assumption regarding the maize variety farmers had planted. A payout was made in 2017, by which point the response had cost around $395 million. 

Building Firmer Ground: Five Fixes


We clearly need disaster data. Without databases like EM-DAT and DesInventar, we would not be able to understand and respond to disasters. It would be far more difficult to respond to climate change and plan adaptation strategies to prevent future disasters. But they are far from perfect.

Improvement is possible, though. Indeed, as the world warms, and climate-related disasters become more frequent, improvement is necessary.

First: we must begin to treat disaster databases not as a single source of truth but as part of a system. Each disaster database is a measurement tool with reported limitations, but considering them together can limit the errors. Resource allocation should be triangulated between different disaster databases and local disaster inventories. This will help limit missing data — especially vital given that smaller, recurring events represent an important share of the disaster impact.

Secondly, disaster impact should be reported in ranges, not in a headline figure alone. It is too easy for policymakers to focus on a single number without taking into account the uncertainty behind it. In 2015, the Integrated Research on Disaster Risk program recommended that disaster data should include reliability information such as a quality score or uncertainty level. Initially reported mortality figures from Hurricane Maria were 46 times lower than those produced by the excess mortality analysis. A reporting range would not have eliminated the discrepancy, but it would signal to policymakers that the number was provisional rather than definitive. 

Third, we must verify official counts independently. Governments are not always incentivized to tell the truth, and even if they are attempting to do so, different standards can lead to vastly different estimates of damage. Instead of relying on a count of people in a damaged area, we should focus on excess mortality as a standard post-disaster metric. This would provide an independent data point against which official figures can be assessed; if a government gives a figure that is many times less than the number of excess deaths, they can be called to account.

We can also use satellite imagery to validate data. This was used to great effect after the Haiti earthquake in 2010, as well as in Turkey after the 2023 earthquakes. These technologies cannot replace ground-level data collection, as they cannot count individual people. However, they provide a form of independent analysis that can be used to compare against other figures that enter disaster databases. This is particularly useful in contexts with weak data collection or reporting infrastructures; in countries like Haiti, it can be nearly impossible to collect data door-to-door.

The fourth fix goes hand in hand with this. We must also better fund local data systems. Several countries have adopted DesInventar-based systems for their own disaster loss accounting, but there are few incentives for maintaining these systems. Every year, governments need to train personnel, validate data and verify that interconnected systems actually function together. Each of these costs money, and none happens automatically; international organizations should help support this where possible.

Fifth, make the limitations of the data visible. No policy document should use disaster data without caveats. Each disaster database comes with its own biases; none is perfect. Without caveats, policymakers may take the data off-the-shelf without considering those biases. Every report that cites disaster data should include material like SDG monitoring metadata, INFORM’s reliability score and Climate Analytics’ loss and damage briefing to provide the reader with context about the data reliability.

No system is perfect, and the systems built to account for the impacts of disasters, including who was affected, the size of the human losses and the economic cost, will always carry intrinsic assumptions, political pressures and institutional limitations. But we can do better than the current system, particularly as natural disaster frequency increases due to climate change. Preventable mistakes will come with a death toll, and right now, disaster databases risk mistaking what is currently reported for what matters. 

Matheus de Souza is a PhD student in Disaster Science and Management at the University of Delaware and has worked with different humanitarian organizations such as the United Nations High Commissioner for Refugees and the Norwegian Refugee Council. He studies several aspects of disasters, with a focus on inter-organization coordination.

Cartoon of people saying "their data is the real disaster"

If you have comments on this article, or wish to contribute to the discussion, please email them to letters@indevelopmentmag.com. Responses will be featured in a letters section.
It was the sort of puzzle that you don’t notice at first. It was Juba, South Sudan, in 2012; a place where and time when, frankly, problems were not hard to find. The perhaps surprising absence of a problem was easy to overlook.

I was there helping the government think about the management of its pooled fund — the primary structure via which donors put some funds under some small measure of government control — and working to expand its agency where possible, rather than letting the desires of donor organizations and their representatives be the driving force. Whenever I asked for data to help us better understand context, it was there. It also hung together into a coherent picture — at first pass, at least, it seemed accurate. People trusted the data they got; donors, government, NGOs seemed to report government data to me without the subtext of an eye roll indicating “who knows if this is at all accurate … but here’s what we have.”

This was unusual; when I had worked in other developing countries, the prevailing view was often that the numbers just couldn’t be trusted. No one thought the data in South Sudan was perfect, of course, but it was remarkably reliable for a newly independent country the size of France with the population density of Sweden.

Why Do Some Things Work Surprisingly Well?

This puzzle stayed with me; if it was a mystery novel, it might have been “the curious case of the excellent data.” Some years later I was researching the importance of mission-driven public servants when I asked Fiona Davies for her recommendations of the most impressive, mission-motivated leaders she’d come across in her wanderings through the world.1 Her answer was one name: Labanya Margaret, the longtime director general of the National Bureau of Statistics in South Sudan.2 When I found her, I had found the answer to my puzzle.

Margaret is a true believer in the power of statistics – and one who conveyed that passion, that sense of importance, to her staff. She says that “the data is not for the Bureau of Statistics. It is the voice of the voiceless. The population is the ones saying they did not eat. … The health data says women are dying while delivering.” 

As Margaret put it – speaking in the reverent and awestruck tone many reserve for prayer — “Numbers change people’s lives.” For Margaret, good data allows better decision-making – with accuracy key to generating those welfare impacts. 

Building up the National Bureau of Statistics in her new nation was no small feat. The country had no baseline data – almost all information was being collected for the very first time. It is hard to imagine a more difficult environment for monitoring performance, and thus for a management strategy focused on ensuring compliance – how could Labanya know if her staff had collected accurate data, if there was nothing to compare it to? 

Labanya’s supervisors empowered her to exercise judgment and implement the solutions she thought were most effective. She in turn worked to create a sense of shared mission and collective commitment. Labanya was “loving and respecting” of her staff. She focused on making sure she could “understand the interest of (her) team.” She wanted to “generate and connect with them. Allow them to explain their position to (her).” She remembers, “Whenever we went to the field, I made sure to place (the staff in my mind), to connect the face to the place where I saw him or her.” 

Margaret placed great emphasis on living up to her commitments to staff – something that is not always the case in places where employees have little recourse for mistreatment. “When you say you will pay them, you have to pay them on time: ‘We will pay you, and we’re going to pay you $10. It’s $10, not less.’” 

And it wasn’t just about the staff. Labanya saw data collection as a joint effort between the many members of her team and the population participating in the survey: “Whatever we had done was not our effort but the effort of a collective team and also their own, the people from whom we collected this information, so we constantly went back to thank them and to really recognize their contribution.” “The numbers are telling exactly what (the people) are going through: the pain they are suffering, the joy and their future visions.” 

The result? Data that was extremely high quality. In a context where nothing could be taken for granted — where one couldn’t even rely on the water — they had sent out enumerators to interview the population and bring back information, and it had worked! You need not take my word for it; a Harvard Kennedy School paper describes one of the bureau’s key initiatives, an innovative high frequency household survey, as having “achieved rapid success.”3 World Bank researchers described the survey as innovative and highly reliable – a model for how to collect data in difficult contexts.4

Lots of Stuff Works Pretty Well When You Might Not Expect It – and When It Does, It Reminds Us That Every What Problem Is a Who Problem

Not every agency or every task has the blessing of a Margaret trying to make it work well on behalf of the state. But there is nonetheless a very real sense in which Margaret is typical, not exceptional.

For all the things not working in the world, there are many that do – and where they do, you very frequently find excellent managers who care about the mission and empower their staff in ways that encourage them to feel similarly. Sociologist Erin McDonnell finds excellent mission-motivated bureaucrats who are critical to the capacity of high-performing sections of multiple public organizations in Ghana as well as in Nigeria, Kenya, Brazil, and China.5 Political scientist Merilee Grindle found nearly 30 years ago that management style and (high) performance expectations were key to the cultures of organizations that perform well in a study of 29 organizations across six countries. 6

In contrast, monitoring and control — the workhorse “technology” for trying to improve implementation — very often doesn’t work. A series of carefully identified empirical studies show that an approach based on controlling your employees very frequently undermines performance – and does so even more as tasks become harder to monitor. 7

The difference in management can make a large difference. In one illustrative example, a group of economists found that moving the individuals and organizations at the 25th percentile of effectiveness in Russian public procurement to the 75th percentile would result in 13.9% in savings; this represents about $10 billion a year in potential savings.8

One management aphorism goes “Every what problem is a who problem.” Coined (or at least codified) in a business book by Ben Horowitz, cofounder of mega-successful venture firm Andreessen Horowitz, it is meant to remind the (largely private sector, and in particular technology-focused) readership that it is natural and easy to think of capacity challenges as technical in nature.9 That isn’t true, though, as the evidence shows; capacity challenges are almost always about people, and the environments in which those people are placed.

It’s Not About the Individual; It’s About the Team

One possible way of taking the insight that it all boils down to people would be to try to just figure out who the good ones are and have them do the work. Let’s hire those 75th-percentile procurement agents and fire the 25th-percentile ones!

While it’s certainly true not all people are created equal in ability, motivation or orientation to a given task, this misses Horowitz’s – and the literature’s – point.

Yes, individuals matter. But the way to build sustainable capacity is not to hope to win the “good team” lottery or even think that hiring the best – most skilled, most mission motivated, etc. – is enough. It’s to build and support a group – a unit, an agency, an organization – that collectively has the skills, managerial processes and norms to generate good performance.

The World Bank’s Bureaucracy Lab has created the Worldwide Bureaucracy Indicators, among our best data sources for internationally comparative statistics regarding public sectors around the world. 

Dan Rogger, the lab’s colead, summarizes his central conclusion from the lab’s work as follows:

Government Is Fundamentally Diverse

This may seem like a tautology, but it isn’t. We often speak of government as if it were one actor, focusing on the actions of “Washington,” “London” or “Juba.”

But Washington isn’t one actor — it is closer to a society than an individual. What happens depends on what those individuals do. And what those individuals do depends substantially on their work environments, recruitment and orientation.

Those experiences can vary widely across countries. The Global Survey of Public Servants (which Rogger is a cocreator of alongside Frank Fukuyama, Christian Schuster and others) shows that 96% of Romanian public servants trust their colleagues; only 54% of Ghanaians do.

Graph showing public servants' trust in their colleagues by country
Trust in Colleagues by Country.

Great; this would seem to suggest it’s right to think of “Washington” and “Juba” — that countries matter. And they certainly do.

But this is just the tip of the proverbial iceberg. We see a similarly diverse range of responses by institution within a country.

Chart showing levels of trust within different departments of the Ghanaian government
Trust in colleagues by public servants in Ghana, broken down by government department.

Some institutions are high trust; some are low. Indeed, trust varies more within a country as does between countries.

Chart showing the variation of trust within country vs. across country
Levels of trust differs as much within Ghanaian institutions as it does between Romania and Ghana.

There is no sub-institution data publicly reported in the Global Survey of Public Servants. But if there was – if we could see differences by department – I am very confident we’d see a similar range. If we could go below departments to individual teams, I expect we’d see the same pattern again.

There’s an important takeaway here. When we talk of a government – or what it’s like to work in government – we generalize. That’s not meaningless – there are real ways in which countries differ. But the more we want to build capacity, the less useful these national-level summaries are. We care less about the entire government and more about what is happening within each team in each department.

Sometimes what these teams need is more technical skills — training in Excel or Python or (more likely these days) Claude Code. But more often it requires changing things broader than the knowledge held in one human’s head – it requires changing an organizational system.

Management that empowers – that allows autonomy, cultivates competence and creates connection to peers and purpose – is a powerful tool to improve systems. It both attracts the mission motivated and helps current employees become more mission motivated.10 It can help transform departments from places where people clock in and out to places where employees want to produce the best possible output.

Making the Whole Garment Out of the Fabric in the Pocket

Often people believe that bureaucrats in the Global South are worse at their jobs than those in the Global North. They are more corrupt, less efficient, uninterested in actually doing their job. Conversations in the Global South therefore focus instead on corruption and how control and monitoring can root it out. Indeed, the theory seems to be that the only way to improve their job performance is to control them — make sure they don’t have time to slack off, monitor every task and allow absolutely no deviation from protocol.

But there is no evidence that the people who work for government in developing countries are systematically “worse” in terms of motivation or orientation toward serving the public good than any others.11 Indeed, focusing on control is probably making the government function worse. Few high performers want to work in an environment where their bosses spend every second of the day preventing employees from doing bad things, rather than supporting them to do good things. By trying to prevent corruption, these governments are selecting for the people who are most likely to tolerate micromanagement.

In all countries, the people who work for government are people, in all their diversity and complexity. Few of these people want to be micromanaged. But we collectively fail to imagine empowered, motivated, high-performing developing world government teams. Building teams like this doesn’t require more control; indeed, it requires the exact opposite. It requires building mission alignment and trusting and empowering public servants.

There are myriad ways to support and scaffold an empowerment-first approach. To name just a few: dedicated effort to build “green tape” policies that build a defense for bureaucrats who wish to exercise judgment in service of the mission; peer discussion and empowerment; and management practices that shift culture to make intelligent risk-taking psychologically safe. Emerging technology can be a partner in this; i.e., an AI agent that can be consulted not just for information, but for permission to act in a particular way given the circumstances — enabling public servants to not feel they must risk reprimand to best serve citizens.

It is true there are civil servants who simply don’t have the skills for the job they hold. But even where skills are genuinely missing in the public service, an approach that starts with the under-skilled individual and what will give them a sense of agency, purpose and contribution is still critical. The evidence is clear that people learn best when they are motivated to learn – when they feel the autonomy, the support, the agency to put that learning to use.12 To build capacity means, first and foremost, to start with diagnosis – who the staff are, how they think about their work and what they need to want to move forward.

A capacity-building journey needs a destination – but first it needs an origin, and a pathway there. Margaret faced a seemingly impossible task – but rather than tackle it as a technical problem, she approached it as a human one. She did not prioritize monitoring her team, recognizing the impossibility of such an approach for the task in front of her.13 Instead, she treated her people with respect and dignity – she sought (and often managed) to inspire commitment to the cause that meant so much to her – getting the data right, so that better decisions could be made.

It’s Not Just About the Metrics

Margaret has said that “numbers change people’s lives.” 

I find this beautiful – and believe it to be true. But it’s only part of the story. If we zoom out just a bit, we see that it’s the Margarets of the world inspiring and managing in ways that convince the people of South Sudan’s National Bureau of Statistics that numbers change people’s lives, which in turn led to the successful gathering of those numbers.

We don’t just have to wait around for Margarets, any more than Margaret waited around to be blessed with a team that already cared deeply about the transformative power of accurate data. We can cultivate and till the soil in which such organizational cultures grow. 

Margaret took a piece of fabric and sewed it into a pocket. With the right approach, capacity-building efforts focused on how to build organizational systems that start by centering the ambitions of the many good humans who populate them might make a whole garment out of the cloth. If we all learn that from Margaret’s example, we might collectively be able to build a better world.

Dan Honig is a professor at Georgetown McCourt School of Public Policy and associate professor at University College London’s Department of Political Science. He works on improving the organization of government – usually by taking more account of the people who work for it – with the aim of bettering citizens’ lives and the relationship between states and citizens.

If you have comments on this article, or wish to contribute to the discussion, please email them to letters@indevelopmentmag.com. Responses will be featured in a letters section.
  1. I was writing a book on mission motivated public servants and their importance; a full profile of Margaret appears in Dan Honig, Mission Driven Bureaucrats (Oxford University Press, 2024). ↩︎
  2. At time of writing South Sudan’s minister for trade and industry. ↩︎
  3. Greg Larson, Peter Biar Ajak and Lant Pritchett, “South Sudan’s Capability Trap: Building a State with Disruptive Innovation,” (CID Working Paper 268, Harvard Kennedy School, 2013). ↩︎
  4. Utz Pape and Luca Parisotto, ”Estimating Poverty in a Fragile Context: The High Frequency Survey in South Sudan” (Policy Research Working Paper 8722, World Bank, 2019). ↩︎
  5. Erin McDonnell, Patchwork Leviathan: Pockets of Bureaucratic Effectiveness in Developing States (Princeton University Press, 2020). ↩︎
  6. Merilee Grindle, “Divergent Cultures? When Public Organizations Perform Well in Developing Countries,” World Development 25, no. 4 (1997): 481-495. ↩︎
  7. See e.g., Oriana Bandiera, Michael Carlos Best, Adnan Qadir Khan and Andrea Prat, “The Allocation of Authority in Organizations: A Field Experiment with Bureaucrats,” Quarterly Journal of Economics 136, no. 4 (2021): 2195-2242; Imran Rasul, Daniel Rogger and Martin J. Williams, “Management, Organizational Performance, and Task Clarity: Evidence from Ghana’s Civil Service,” Journal of Public Administration Research and Theory 31, no. 2 (2021): 259-277. More research in this vein reported and summarized in Honig, Mission Driven Bureaucrats.
    ↩︎
  8. Michael Best, Jonas Hjort and David Szakonyi, “Individuals and Organizations as Sources of State Effectiveness,” American Economic Review 113, no. 8 (2023): 2121-67. ↩︎
  9. Ben Horowitz. The Hard Thing About Hard Things (Harper Business, 2014). ↩︎
  10. Honig, Mission Driven Bureaucrats. ↩︎
  11.  See Honig, Mission Driven Bureaucrats, 63-6 for an overview of these data. ↩︎
  12. This is a vast literature but for a meta-analysis/overview see e.g., Joshua Howard, Julien Bureau, Frédéric Guay, Jane Chong and Richard Ryan, Student Motivation and Associated Outcomes: A Meta-Analysis From Self-Determination Theory,” Perspectives in Psychological Science 16, no. 6 (2021):1300-23. ↩︎
  13. Though reporting and performance appraisal were still present, as they must be in any good functioning system; the question is one of relative emphasis, not the existence of any controls. ↩︎

Even as global progress against poverty seems to slow, India has remained a bright spot. In the last several decades, the now most populous country’s transformation has been nothing short of extraordinary, with per capita incomes increasing by over a factor of six in a quarter century.

The share of the country’s population living in extreme poverty has been slashed, as has the rate of child mortality, which fell by nearly 80% from 1993 to 2021.

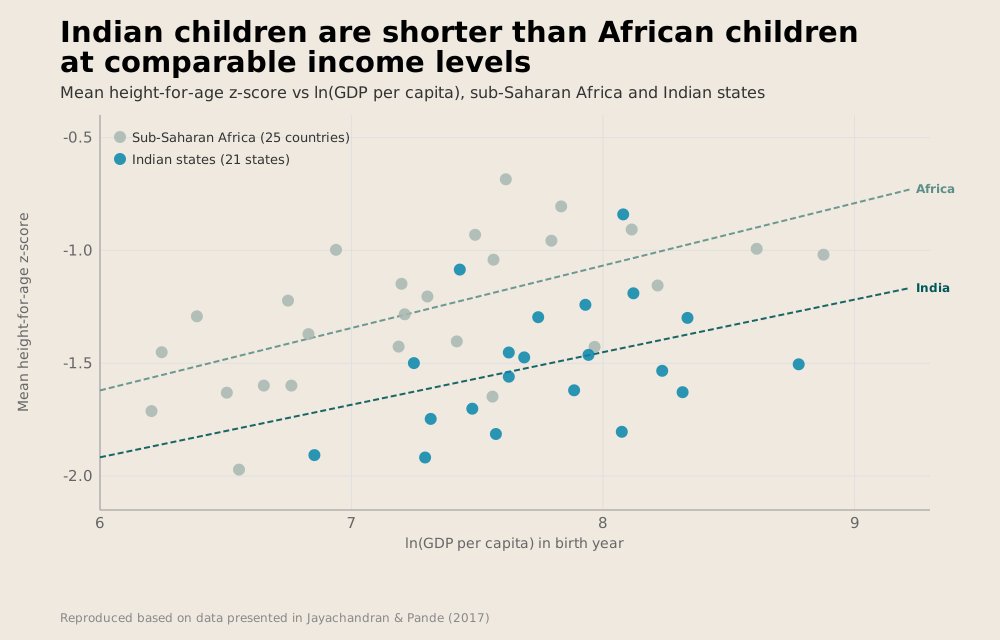
So why are its children so short? Even as India’s per capita income has outpaced the per capita incomes of many of its counterparts in Sub-Saharan Africa, India’s children remain some of the shortest in the world—much shorter than their peers in Sub-Saharan Africa. India is a rising giant, but its children are anything but.

Chart of height-for-age z-score vs. ln(GDP/capita) in Africa and India
Indian children are shorter than African children at comparable income levels.

To readers in rich countries, this fact may not immediately come across as cause for concern. Height is a product of genetics, so short Indian children may simply reflect differences in potential heights across ethnic groups. Indians may simply be a short people—genetically prone to being shorter than Africans or Europeans.

Thinking of height as predominantly a product of genetic inheritance, however, is a luxury of having a high income. In the United States—and other rich countries—children rarely eat too little or become too sick to grow to their full potential height. There, height largely is a product of genetics. This is not the case in many poor countries, where malnutrition and childhood disease abound. Many people in poor countries are short in adulthood not because of short parents, but because they do not eat enough or are too sick in childhood to grow. Calories in, centimeters out.

Childhood stunting can have lasting implications. Economists have long shown that taller people earn more. This result is likely not because employers simply prefer tall people; rather, nutrition also matters for cognitive development. Malnourishment starves the growing brain of much-needed energy, and stunting may be a physical sign that children are not achieving their maximum cognitive potential. Furthermore, if malnourished children are stunted both physically and cognitively, effects may persist long beyond childhood. Full nutrition in adulthood may be insufficient to make up for deficits early in life.

Governments therefore care a great deal about how short their citizens are. They also want to know why children aren’t getting what they need to grow. It behooves a government to know if it is childhood illnesses, sanitation or another factor at play. Without this information, they risk not only a physically but cognitively stunted generation. Though heights no longer remain our only measures of population well-being, they are a useful and transparent yardstick. For that reason, measuring them has become a central part of many household survey programs, including India’s National Family Health Survey (NFHS).

Heights are also relatively easy to measure. It is much easier to pull out a measuring tape than collect a blood sample. We can even look at historical data to see the rise and fall of civilizations.

One of the most transparent ways to see the declining fortunes of Native Americans in the American Great Plains is through falling heights. Native Americans were once some of the tallest peoples in the world, a status they abruptly lost with the slaughter of the bison at the end of the 19th century.

So: Rich countries should have tall kids. And as countries get richer, their kids should get taller. But in this simple taxonomy, India is a dramatic outlier. Heights have grown alongside the country’s per capita income, but at a remarkably slow rate—much slower than in other countries.

Is it just genetics? It can be difficult to tell, because you have to disentangle a person from the place where they live. Telling whether a child in Bihar is short because they live in India or are Indian is an impossible task that even the best econometric tools cannot hope to resolve. To find answers, researchers therefore study people for whom person and place are decoupled: immigrants. 

Economists Caterina Alacevich and Alessandro Tarozzi do just that, studying Indian families who migrate to the United Kingdom. When they arrive, Indian immigrants are shorter than native Brits. However, remarkably, their young children are as tall as their British peers, catching up in a matter of one generation.

This finding is striking. It does not seem to be simply that Indians are just shorter than Africans (or Brits). Something causes Indian children to stand shorter than the children of other nations. And whatever that something is does not fit in the overhead compartment when flying from Delhi to London.

If it’s not genetics, then what explains the Indian height enigma? One answer may be (eldest) son preference. Thirty-five years ago, Nobel Prize-winning economist Amartya Sen drew the world’s attention to an unsettling fact: The world had fewer girls than it should, with many Asian and African countries having a larger male than female population. The number of “missing women,” and the reasons they are missing, are controversial, but researchers often point to causes like sex-selective abortion or female infanticide.

Even when girls are born, though, they may receive fewer resources. In India, eldest sons in Hindu families often play important social roles, living with aging parents and inheriting property. Eldest girls—or indeed, girls in general—play no such role. This may encourage poor families—with only limited resources—to prioritize eldest sons over other children. In a paper in the Quarterly Journal of Economics, for example, economists Seema Jayachandran and Ilyana Kuziemko show that women stop breastfeeding daughters earlier if they do not have older brothers. Because breastfeeding suppresses ovulation and delays the return of fertility, mothers without sons may wean their daughters earlier in the hopes of conceiving a boy. 

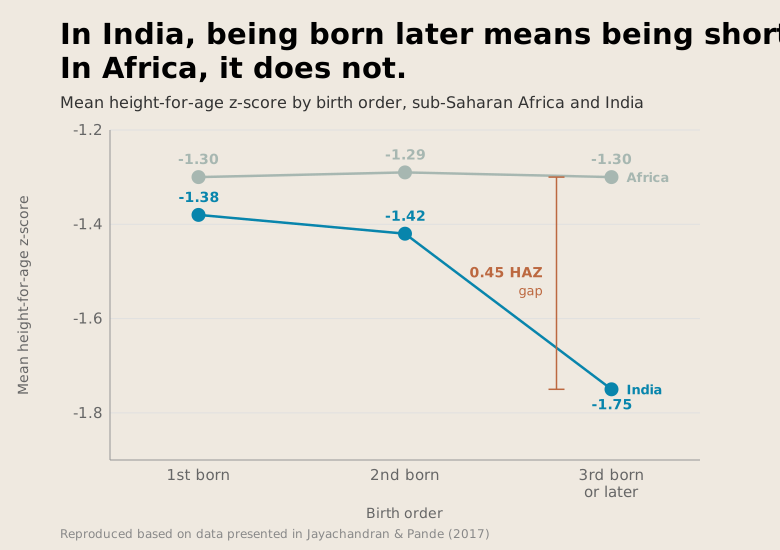
Perhaps it is simply that eldest children, regardless of gender, get the resources. In the American Economic Review, Jayachandran and Rohini Pande argue this is the case in the aptly named paper “Why are Indian Children So Short?”  showing that though on average Indian children are shorter than African ones, this is not true for all types of children. Firstborns in India are as tall as their counterparts in Sub-Saharan Africa, but a gaping divide emerges for non-eldest children. Thirdborns and later in India are a third of a standard deviation shorter than their counterparts in Sub-Saharan Africa, compared to no gap for firstborns. Eldest sons are prioritized, and eldest daughters—by nature of their age—are less likely to have an older brother to compete with for resources during the nutritionally vital early years of life. This favoritism may come at the expense of later-born children.

Chart of height-for-age z-score vs. birth order in both Africa and India
Birth order affects height much more in India than in Africa.

Jayachandran and Pande’s paper has been very influential in academic economics, becoming a somewhat definitive source on the role of son preference in Indian society. However, their claims have not gone unchallenged. Diane Coffey, a sociologist, and Dean Spears, an economist and demographer, both of the University of Texas at Austin, have questioned the birth order hypothesis.

What could explain the fact that firstborn sons are taller than second or thirdborns? One answer is Jayachandran and Pande’s—eldest son preference. Another is that firstborns come from different kinds of families than second or thirdborns. The sample of firstborns across a whole population includes many kids from families with one child. Secondborns, by contrast, come from families with at least two children, and thirdborns necessarily come from families with at least three kids. In a recent paper, Spears and Coffey alongside economist Jere Behrman show that this effect is important in India, where larger families are also generally poorer. In other words, firstborns without siblings are more likely to come from richer families, where it is less likely that children won’t have enough to eat. Jayachandran and Pande are aware of this fact, and adjust for maternal characteristics to try and account for it. However, Spears, Coffey, and Behrman argue that conditioning on family size directly largely eliminates the link between birth order and children’s height.

If eldest son preference is not a silver bullet, then what can explain why Indian children are so short? The best alternative answer we have may lie with where people in India use the bathroom.

Alongside nutritional inputs, children’s heights are a product of their disease environment in childhood. Parasitic worm infections can sap nutrients from growing children, and diarrhea caused by exposure to fecal pathogens can induce violent and dangerous losses of fluids and nutrients. Avoiding these outcomes largely comes down to improving sanitation, which remains poor in many developing countries.

Despite its rapid economic progress, India remains an outlier in sanitation coverage as well. In 2019-21, large shares of India’s population primarily defecated in the open—that is, not in a toilet or latrine, but simply … on the ground. In a densely populated country, this is a recipe for public health concern. Fecal bacteria wreak havoc on children’s digestive tracts, in many cases causing chronic gut infections that limit nutrient absorption. These concerns have prompted global campaigns to eliminate open defecation, from a Gates-funded moonshot to invent a “next generation toilet” to an aptly named theme song and social media campaign from UNICEF India.

Whether, why and to what extent open defecation persists in India are controversial questions, with at times surprisingly vicious politics behind them. In 2019, Prime Minister Narendra Modi declared India “open defecation free”—thanks largely to the Swachh Bharat Mission, an initiative aimed at eliminating the practice in part through the construction of over 100 million latrines.

Many have called this claim into question, in part because of clear evidence to the contrary in the National Family Health Survey (NFHS), a national household survey program, one round of which began that year. Between 2015-16 and 2019-21, the share of households reporting that they practice open defecation fell from 55 to 27%—an impressive drop, but far from elimination.

Importantly, the way NFHS asks about open defecation may also overstate progress. Asking whether each member of a household defecates in the open yields higher rates than asking whether a household collectively does. Even in households where some members use a latrine, other household members may continue to defecate in the open. This would mean that as a percentage of population, far more than 27% could defecate in the open.

Coffey and Spears’s research suggests that this may be more likely than son preference to explain the disappointingly low stature of India’s children.

There is some evidence to suggest it could be. Randomized experiments comprising interventions aimed at improving sanitation coverage have pointed to at times positive effects on children’s heights. Descriptive evidence also suggests that differences in sanitation coverage are more than sufficient to explain the Indian height enigma: If reweighted to take into account India’s density of open defecation per square kilometer, African heights would look remarkably similar to Indian heights.

Though strategies like community-led total sanitation—wherein latrine construction is paired with behavioral change interventions, often aimed to invoke “shame” among those who defecate in the open—can yield meaningful improvements in sanitation, they are far from a silver bullet. Evaluating whether, in an open defecation-free environment, India’s children would grow as tall as their counterparts in Africa is a difficult if not impossible counterfactual to construct.

It is possible that both stories are at least some of the explanation. Indian girls could receive fewer resources than their brothers and Indians might suffer from the likelihood of open defecation. Those aren’t even the only two hypotheses in the literature. Alongside poor sanitation and cultural norms emphasizing the importance of eldest sons, Indian diets are often high in carbohydrates and low on proteins and micronutrients, failing to meet dietary diversity standards. At least descriptively, these patterns can explain some of the disparities in stunting rates across districts of India. But isolating this effect causally is challenging. Diets are difficult to randomly assign, meaning researchers are forced to rely on “natural experiments.” One paper, leveraging exposure to India’s “Green Revolution” as a source of variation, finds that improved yields of wheat and rice reduced heights, perhaps as a result of reductions in protein intake and dietary diversity.

Litigating these debates is a challenge and a parable for just how difficult finding answers to even the most simple and consequential of questions can be. The Indian height enigma is also an allegory for the power of data at a time when the infrastructure essential to measuring progress—both in India and globally—is teetering on the edge. 

Prior to the 1980s, the world was remarkably devoid of data on the lives of the world’s poorest people; working out who was most deprived or what people died of was much harder and depended on less systematic information. At that time, we would not even know that Indian children were short, let alone have the ability to determine why. Household survey programs lent researchers new scope to examine the world and uncover paradoxes and facts with remarkably broad implications. A data-rich future is far from assured, however. In India, data collection has also taken a remarkably political turn, with a long-delayed census sparking controversy.

The most recent round of the NFHS—which was released just two months before this piece went to print—provides some promising signs that rates of stunting among India’s children have continued to fall. However, the convenient removal of data points related to sanitation, childhood sex ratios, and anemia—at least in early reports from the survey—will make the causes of this progress much harder to parse. The Indian enigma will likely continue to baffle, especially if the data used to interrogate it is allowed to slip away.

Wilson King is a PhD student in development economics at the University of California, Berkeley. His research focuses on health in low and middle-income countries.

cartoon of a man pretending to be as tall as a cardboard cutout

If you have comments on this article, or wish to contribute to the discussion, please email them to letters@indevelopmentmag.com. Responses will be featured in a letters section.
What happens when 55 countries try to review medicines together?

The Problem of Regulatory Delay

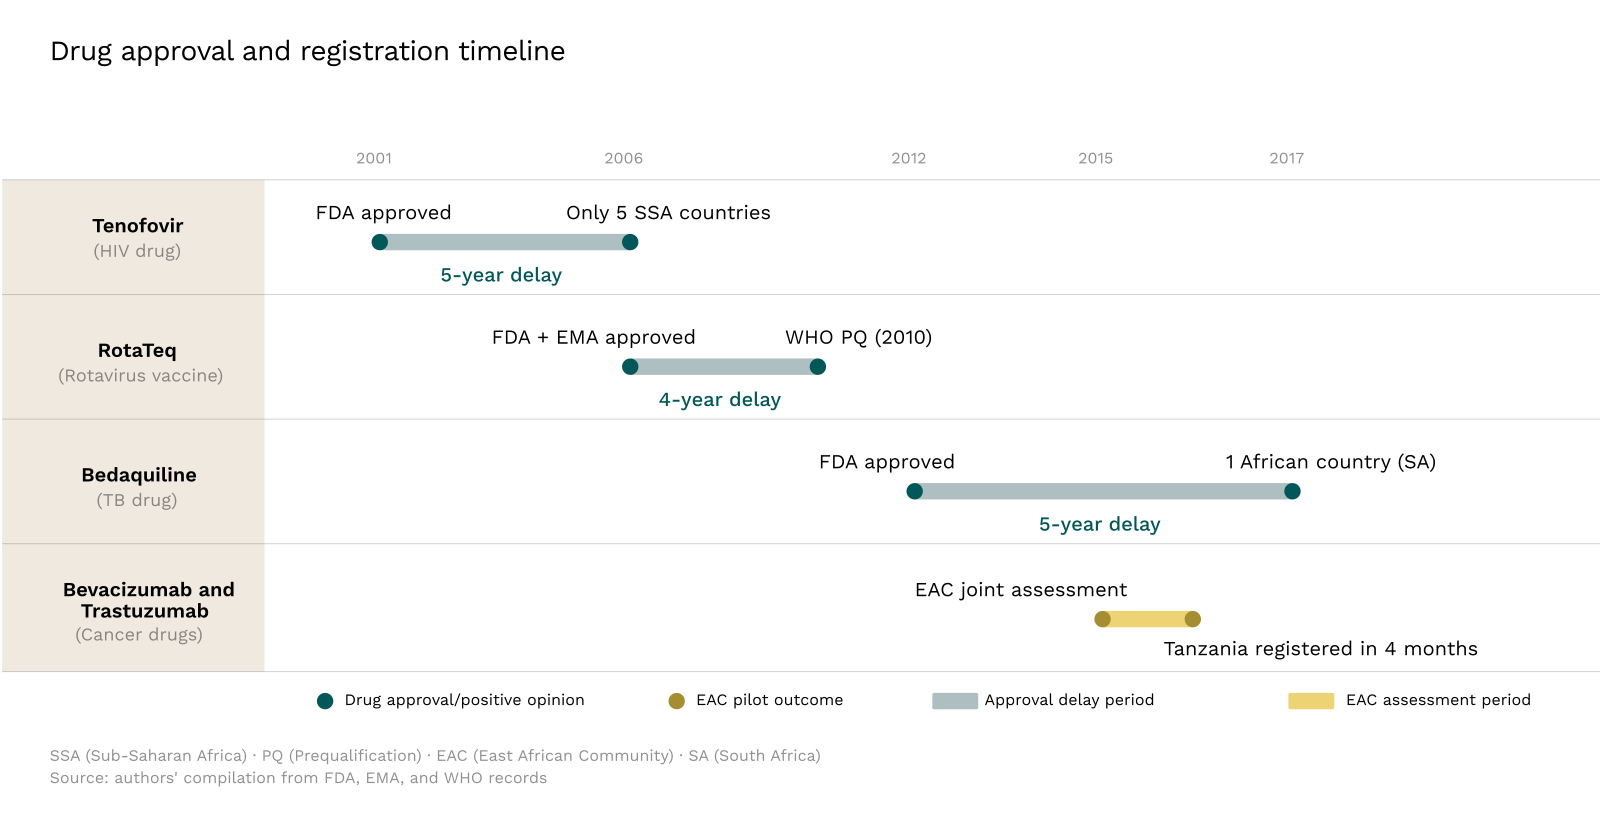
The drug tenofovir disoproxil fumarate, a cornerstone of HIV treatment, was approved by the United States Food and Drug Administration in 2001. Its better safety profile quickly made it a standard treatment in the US and Europe. It should have been a shoo-in in Africa; at the end of 2001, sub-Saharan Africa accounted for over 70% of the world’s HIV/AIDS cases, while an estimated 2.3 million people on the continent died of the disease that year.

Instead, when African countries began rolling out their national programs to address the AIDS epidemic, with Botswana leading the way in 2002, most patients started on stavudine-based regimens.1 Stavudine was cheap but toxic, causing disfiguring and sometimes life-threatening side effects. In South Africa, one study showed that 30% of patients stopped taking it within three years.

By early 2006, the manufacturer, Gilead, had registered it in only five sub-Saharan African countries. Even in South Africa, one of the region’s larger markets, the company did not apply for registration until late 2005.

In Africa, programs only began replacing stavudine with tenofovir in around 2010.2 Had Gilead filed in African markets alongside the FDA, tenofovir could have been available from the start.3

This same pattern was repeated with bedaquiline, the first new class of tuberculosis drug in over 40 years. Following fast-track approvals by the FDA in 2012 and the European Medicines Agency in 2014, it was hailed as a breakthrough against drug-resistant tuberculosis, a disease that was killing over a million people annually. Most of those people lived in Africa and Southeast Asia. Yet, by October 2014, it had been registered in just one African country (South Africa). In South Africa, mortality among drug-resistant TB patients was roughly half on bedaquiline-based regimens compared to standard treatment. Elsewhere, patients continued to receive inferior drugs.4

The Nature of Regulatory Delay

On average, in sub-Saharan Africa, there is a gap of four to seven years between a drug or vaccine’s first submission to a regulatory agency in a high-income country and its approval. Two distinct regulatory barriers drive this.

The first is submission delay. Africa has 55 countries, and manufacturers must usually file separately in each one. This means repeated applications, different technical requirements, and higher costs. For firms weighing returns in any single market, the arithmetic often does not favor registration. They focus on larger, richer markets instead, so products are either not submitted or arrive years later. That was tenofovir’s fate.

The second is review delay. For example, if you submit a drug for review in Botswana, realistically, you can’t expect to start selling it until three years later. This is much longer than in countries like the US, where a standard review takes 10 months.

Drug reviews can be slow anywhere; the FDA, for instance, missed its own review deadlines for about 1 in 10 products in 2025. However, in developing countries, insufficient staffing at the regulatory agency can be a binding constraint. Reviewing a complex drug dossier requires trained pharmacologists, toxicologists, and clinical experts, as well as laboratory capacity to test product samples and systems to track adverse events once drugs reach patients. Most African countries lack this infrastructure.

According to the WHO, more than 90% of African countries have minimal to no regulatory capacity. For instance, in 2022, South Sudan—a country of about 11 million people—had just 16 staff at its medicines regulatory agency (~1.5 per million residents). By contrast, the US employed about 19,700 (~56 per million residents).

Regulating “Family Style”

Africa is not the only continent with many small countries, nor is it the only one that has faced limited capacity. Regulators around the world have developed three broad responses to submission and review delays. Each has involved some form of cross-border cooperation—call it regulating “family style.”

Harmonization of regulatory requirements across agencies addresses submission delays. When regulators standardize procedures, guidelines, and technical requirements, they make it easier for manufacturers to submit in multiple countries. The International Council for Harmonization has spent decades aligning technical standards across major developed country markets, but much of Asia, Africa, and Latin America remains outside its framework.

Collaborative review goes further: regulators jointly assess applications while retaining national authority. The FDA’s Project Orbis does this for cancer drugs. Since May 2019, the US, Australia, Canada, Singapore, Switzerland, the UK, and others have conducted concurrent reviews, often issuing approvals within days of each other. But this model depends on trust, which is easier when participating agencies have similar levels of capacity.5

Reliance reduces duplication by allowing regulators to defer to trusted authorities. For example, the UK can fast-track approval of drugs already authorized in other major markets.6 The WHO Prequalification Program operates on similar principles, allowing countries to rely on WHO’s assessment rather than conducting their own full review.

However, reliance is only beneficial when the leading authority’s reviews are timely. In 2022, WHO’s full review pathways averaged about 17 months, a reminder that concentrating regulatory work in a single body amplifies the cost of that body’s failures across reliant countries.7

The deepest form of collaboration is supranational regulation. In the European Union, the EMA conducts a single scientific review, and the European Commission issues one authorization valid across all 27 member states. This only works because EU countries agreed to pool sovereignty for drug approval. Without that political foundation, the model is hard to replicate.

The East African Pilot

In 2009, the African Union established a Medicines Regulatory Harmonization initiative.8 Rather than attempting continent-wide harmonization and collaboration immediately, it decided to run a five-year pilot through one of the continent’s existing regional economic communities, soliciting proposals and then funding the most promising plan. The East African Community (EAC) won the bid. Its application was compelling: it already had a customs union and a common market in force, giving its member states genuine experience in cross-border cooperation; it comprised a small number of partner states, most of which shared a common language, culture, and infrastructure; and its national regulators had already been collaborating informally for years.

And so, in 2012, the EAC’s Medicines Regulatory Harmonization (MRH) initiative was launched, covering nearly 150 million people. The initiative targeted reducing submission and review delays by adopting two of the “family style” regulatory approaches: harmonizing requirements and speeding up review by sharing the work among national regulators, while maintaining rigorous standards.

It was not designed as a supranational regulator issuing binding approvals. Applications would be jointly assessed, but final decisions on whether to approve a product would remain at the national level. There would be no central authority for medicine approvals in East Africa.

But it did split the work across countries. A product application was first submitted to Tanzania’s regulatory agency, which was responsible for the initial screening to confirm that all sections were complete. Tanzania then assigned two other national authorities to evaluate the application’s data in full, while Uganda’s regulator simultaneously led the product’s Good Manufacturing Practice assessment. Once these assessments were complete, all EAC regulators came together in a joint session to discuss the findings and reach a consensus recommendation. This was then submitted to the Secretariat, and the manufacturer could use it to apply for national marketing approval in each EAC member state individually.

Process map and milestones for East African Community (EAC) joint assessment procedure pilot. Source: Ngum (2025).

And it worked. Up to a point.

The median timeline for joint assessment fell from about two years to just over a year by 2017, and down to 240 days by 2019. Between 2015 and 2020, the initiative held 10 joint assessment sessions, reviewing 83 product applications, and recommending 36 products for approval in the region. The initiative also succeeded in advancing regulatory harmonization, by developing a Common Technical Document that manufacturers could use for submissions across all partner states. Joint Good Manufacturing Practice inspections began in 2016, pooling expertise and reducing redundant factory visits.

As well as reducing regulatory delay, the joint assessments introduced higher manufacturing standards than many national pathways required. They mandated bioequivalence studies, to demonstrate that generic drugs perform in the body in the same way as branded originals do. National procedures often waived such requirements, but the MRH had the capacity to insist on these.

Beyond speeding up review times, the initiative also sought to encourage drug classes that might not otherwise have been registered. Major global health organizations, such as the WHO, naturally prioritize advancing medical products to fight the highest burden diseases in Africa. These are usually infectious diseases. But as the African population ages, and the burden from infectious diseases has been reduced, non-communicable diseases have become increasingly important. The East African pilot decided to also focus on drug classes that treat these disease types, particularly anticancer and antihypertensive medicines. Before the pilot, such drugs were systematically under-registered: when Kenya’s government attempted to procure essential cancer drugs, nearly a quarter weren’t available in the country. Early joint assessment application data suggests the pilot began to address this gap: between 2015 and 2017, 16% of 49 applications were for oncology drugs and 24% for cardiovascular products.

Perhaps most importantly, the initiative helped build regulatory capacity across the region. When it began, only Kenya, Tanzania, and Uganda had regulatory agencies separate from their ministries of health; Burundi, Rwanda, and Zanzibar, by contrast, had small departments housed within theirs. By cooperating with more established regulators, Rwanda and Zanzibar were able to increase their independence.

But the limitations were equally apparent.

In 2015, Roche used the initiative to seek approval for two established cancer medicines, bevacizumab and trastuzumab.9 The joint assessment proceeded quickly, with a positive recommendation issued within months of submission. Tanzania registered them within four months of the drugs’ application for joint assessment, a remarkable improvement over its 15-month average.

Yet Roche registered the medicines in only only three of the six countries under the initiative at the time. It chose not to pursue the smaller markets. Even with a streamlined process, manufacturers still faced separate national submissions and fees; these markets simply weren’t worth it for Roche.

And the program didn’t fix all regulatory issues. National registration was supposed to take about three months, but sometimes took over a year. When pharmaceutical executives were surveyed about the initiative, their response was measured. They supported its ambitions and noted progress. But final national authorizations still took too long, and some countries failed to recognize joint recommendations.

This last point revealed a deeper tension. The premise of collaborative review is mutual trust. But some national regulators refused to accept the joint decisions. While their rationale isn’t publicly known, it could have been due to a lack of trust. When sharing work across countries with very different capacity levels, those with high capacity may not wish to defer to those with lower capacity.

The introduction of higher standards for generics created its own pressures. During the pilot, the industry became frustrated that the joint regional standards were higher than those previously applied in some member countries. As long as some countries maintain less demanding requirements, regulatory arbitrage—where firms capitalize on regulatory loopholes to avoid unfavorable rules and cut compliance costs—becomes possible, and companies may simply choose to submit only to countries with lower standards.

And there was one other issue. The initiative was meant to become self-sufficient after five years, transitioning from donor funding to fees and contributions from partner states. Nine years later, that transition hasn’t happened. Relying on outside funding introduced more delays to the process, and made the whole endeavor fragile.

Scaling to a Continent

Still, the East African pilot was always intended to lead to something larger. Conversations about a continental regulator date back to 2009, but it took a decade of political negotiation before the African Union formally adopted a treaty establishing the African Medicines Agency (AMA). Scaling the harmonization model to 55 countries had the potential for the same gains seen in East Africa, but it also meant confronting the same obstacles, compounded across a far larger and more diverse region.

Even after treaty adoption, creating the AMA wasn’t easy. In 2020, not long after the agency was created, the continent faced the COVID-19 pandemic. Most African countries lacked sufficient regulatory capacity to handle the approval of new medications and therapies. Instead, they had to depend on authorizations from the FDA, EMA, and WHO, leaving them with little autonomy over which vaccines and treatments they could access—or when. For proponents of the AMA, it was a concrete illustration of what a continental regulator was meant to address. Well-resourced regulators can supplement domestic capacity, but they cannot substitute for it. The AMA is intended as a coordination mechanism designed and governed by African states themselves, rather than relying indefinitely on external authorities. In that sense, the AMA fits within a broader African Union commitment to improve medical capacity on the continent and achieve health sovereignty.10

By the time the AMA officially launched in November 2025, some 39 member states had signed or ratified the treaty. But 16 countries, including South Africa and Nigeria, two of the continent’s largest pharmaceutical markets, had yet to commit, preferring to maintain independent regulatory frameworks. Without them, the AMA is likely to face considerable headwinds, operating with a meaningfully smaller share of total African pharmaceutical trade and a much weaker incentive for companies to engage with the agency at all.

The AMA also faces another significant hurdle. It is a harmonization initiative; it is not a supranational regulator—at least for now. Participation is voluntary, and countries retain the right to disregard its assessments entirely. Despite frequent comparisons, it is not “an EMA for Africa.” If engaging with the AMA and the individual countries costs more time and money than simply submitting to a country directly, companies will take the simpler path. If that isn’t the AMA, the agency risks becoming regulatory theater, significant on paper but inconsequential in practice.

The AMA can draw a clear lesson here from the East African pilot. An industry survey found that most manufacturers had expected joint assessment decisions to be automatically accepted by individual national regulatory authorities. Manufacturers who had expected automatic acceptance lost confidence in the program when they realized that this was not what it did. Setting expectations at the outset and clearly communicating the actual benefits of the AMA will position the continental agency far better with manufacturers than the pilot did.

As with the pilot, financing will also be a pressing question. Since 2022, the AMA has attracted significant external financial support—100 million euros over five years from the EU and the Gates Foundation, alongside contributions from Wellcome, the European Commission, and Belgium. But donor funding has expiration dates. The agency will ultimately require either substantial contributions from member states or it must begin to charge drug manufacturers.11

In many ways, the AMA will take all the challenges experienced in the pilot and amp them up. Building trust was difficult enough across countries in East Africa; it will be all the harder across the entire continent. Even the question of language becomes a serious operational problem: the EAC operates across three languages while the African Union officially recognizes six.12

If it goes well, the AMA could become a trusted coordinator that reduces duplication and accelerates access across the continent. Or, if these tensions aren’t resolved, it could become just another layer of bureaucracy, adding assessments, fees, and complexity without shortening national approval timelines.

Which outcome prevails will depend on whether the AMA can deliver value that justifies the additional step, and whether enough member states have the political will to let it try.

A Worthy Experiment

In many ways, the AMA is more than an experiment in drug regulation. It is an experiment in regional cooperation in the developing world—an experiment in which the stakes are high, resources are scarce, and incentives push toward yet more fragmentation.

The AMA is attempting something genuinely ambitious: regulatory coordination across 1.5 billion people, 55 member states, six languages, and enormous variation in capacity and political will. The EMA took decades to reach its current form, even with the advantage of operating within high-income Europe. Africa has neither time nor the advantages of money. The work will be technical, administrative, and often dull (to all but the most passionate regulatory wonks). But the alternative to a project like the AMA is that essential HIV treatments arrive half a decade late in places that needed them most.

Enlli McAleese is a researcher and advisor focused on strengthening medicines regulatory systems in Africa. She previously served as Regulatory Director at 1Day Sooner and worked on the COVID-19 vaccine rollout at the UK Department of Health & Social Care.

If you have comments on this article, or wish to contribute to the discussion, please email them to letters@indevelopmentmag.com. Responses will be featured in a letters section.
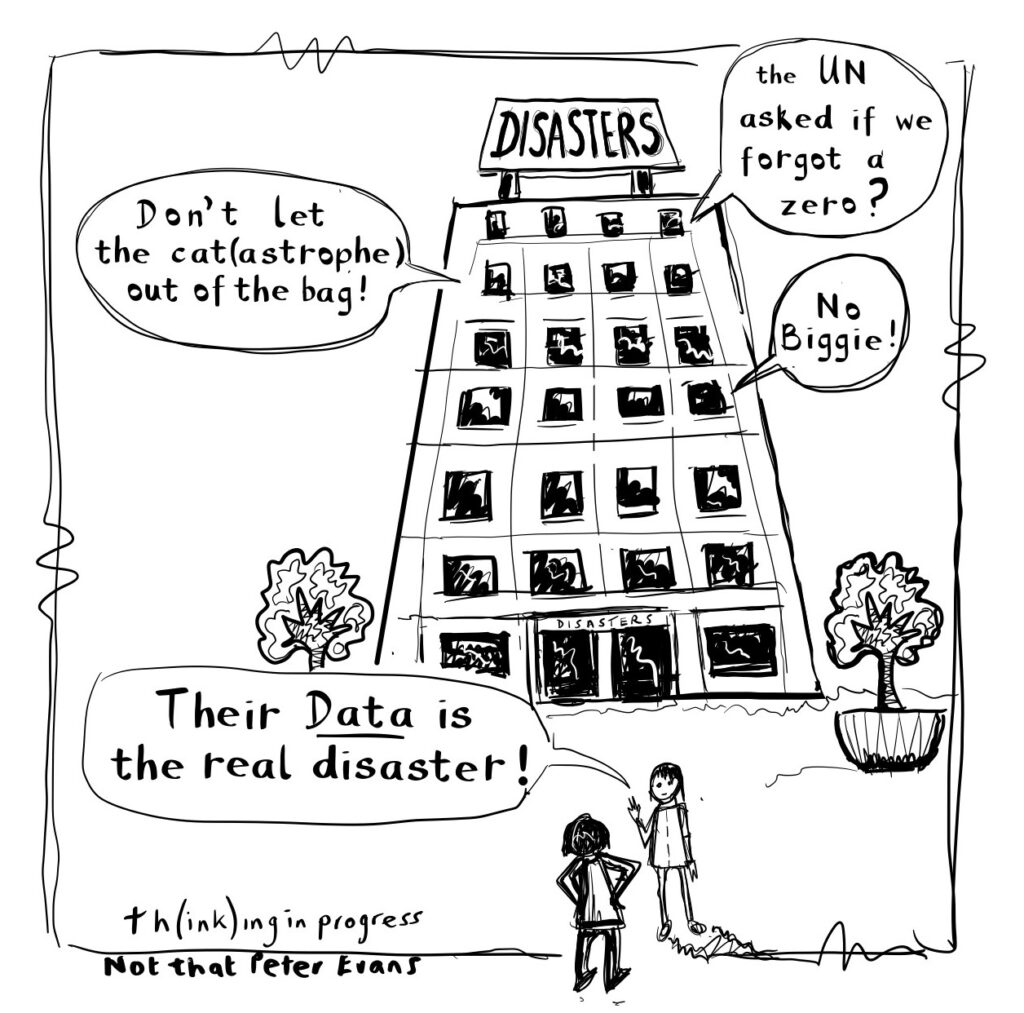
  1. Before the adoption of tenofovir in Africa, first-line antiretroviral therapy primarily relied on older nucleoside reverse transcriptase inhibitors combined with either a non-nucleoside reverse transcriptase inhibitor or a protease inhibitor. Common first-line regimens were stavudine, lamivudine, plus either nevirapine or efavirenz. ↩︎
  2. Studies have shown comparable antiviral efficacy between stavudine and tenofovir, including Gallant et al. (2004) and Kouamou et al. (2022). ↩︎
  3. It bears noting that registration alone may not have guaranteed access, since tenofovir’s price remained prohibitive until Gilead’s voluntary licensing program in 2006 enabled generic production and dramatically reduced costs. Earlier registration, however, would have created the legal precondition for faster licensing negotiations and generic entry. ↩︎
  4. Vaccines follow a slightly different path. Typically, a vaccine needs to obtain WHO prequalification before Gavi, the Vaccine Alliance, will fund it and the United Nations Children’s Fund (UNICEF) will procure it, meaning that delays at the WHO stage ripple forward and block access at scale. National registration adds a further layer, with countries in Sub-Saharan Africa taking an average of one to two years to register a vaccine even after WHO prequalification has been granted. Because Gavi’s funding decisions are tied to WHO prequalification, the WHO prequalification delays tend to have an outsized effect on access compared to any individual country’s regulatory timeline. For example, RotaTeq, Merck’s rotavirus vaccine, was approved by the FDA and the EMA in 2006 but didn’t receive WHO prequalification until 2010, leaving a four-year gap before Gavi could procure it for a disease that kills the vast majority of its victims in low-income settings. ↩︎
  5. Because of this dynamic, collaborative review has historically been used most often by countries with well-established regulatory agencies (such as countries that have WHO-Listed Authorities). ↩︎
  6. If Australia, Canada, the EU, Japan, Singapore, Switzerland, or the US has already licensed a drug, the UK’s Medicines & Healthcare products Regulatory Agency, through its International Recognition Procedure, can issue local authorization far quicker. ↩︎
  7. Ironically, this was largely due to limited resources — the same structural weakness that drives countries to outsource their reviews in the first place. ↩︎
  8. Similar efforts to strengthen regional medicines regulation are underway in other parts of the Global South. In Latin America and the Caribbean, the Pan American Network for Drug Regulatory Harmonization (PANDRH) is hosted by the Pan American Health Organization, and has facilitated regulatory harmonization and reliance since 1999, and, in 2023, the Latin American and Caribbean Medicines and Medical Devices Regulatory Agency (AMLAC) was established. In Southeast Asia, a continental agency has been discussed within the Association of Southeast Asian Nations (ASEAN). Notably, PANDRH, AMLAC and the existing ASEAN regulatory network operate as looser networks centered on harmonization and regulatory reliance rather than on centralized decision-making, and do not carry the same legal authority that the AMA derives from its founding treaty. ↩︎
  9. Approved by the FDA in 2004 and 1998, respectively, and listed by the WHO as essential medicines in 2015. ↩︎
  10. This was not the first time a health crisis had spurred the creation of an African institution. Before the 2014–2016 Ebola outbreak, proposals for a continental public health body in Africa had circulated for years. African leaders had formally acknowledged the need in 2013, but with little urgency. The scale of the outbreak changed that. The African Union’s dependence on outside responders made the institutional gap impossible to ignore, and the Africa Centres for Disease Control and Prevention was established in 2017. ↩︎
  11. This is what the EMA does, but it also offers binding approvals. Africa will need to develop its own approach. ↩︎
  12. Ask the EU about the difficulty of working in many languages. ↩︎

The movement of people could once again be the driving force behind global convergence.

Leaving Genoa in northwest Italy, Luigi Pastene arrived in Boston in 1848, and began selling produce from a pushcart in the city’s North End neighborhood. By the 1870s, permanently settled in the United States, he had been joined in business by his son Pietro, and the pair specialized in selling Italian imports including olive oil and tomato sauce from Naples in southern Italy.

In the same decade, Luigi Vitelli arrived in New York from Naples. First selling lace and handicrafts, he later began importing and marketing canned San Marzano tomatoes. In 1919, he returned to Italy and built his own processing plant for canned tomato exports to the US business, the origin of a firm that expanded into the multinational Vitelli Foods.

Pastene and Vitelli were just two of the millions of Italians and tens of millions of Europeans that emigrated to the New World—many permanently, some temporarily—in the second half of the 19th century and early part of the 20th century, the age of mass migration.

Migrants on a boat to the United States in 1890; image from the Library of Congress.

This migration was not just a boon for the United States. Many migrants sent money home, adding $4 million to $30 million a year to the Italian economy, a US government commission estimated in 1896. Herman Stump, US Commissioner-General of Immigration in the mid 1890s, reported that “the marked increase in the wealth of certain sections of Italy can be traced directly to the money earned in the United States.” But it was not simply about the money; emigration soaked up excess labor, returned migrants brought back new skills and contacts, and migration links drove stronger trade and investment relationships.

Indeed, the age of mass migration coincided with—and was possibly one of the drivers behind—a period of rapid income convergence between the old and new worlds. By 1910, incomes in Italy were perhaps 30% higher than they would have been without emigration.

Today, we are once again in an age of mass migration. And the movement of people could again be the driving force behind global convergence—especially if origin countries seize the opportunity.

A New Age of Mass Migration

The number of migrants worldwide has been rising again. One estimate for the first decade of the 20th century—the previous peak—is that 1.67% of the world’s population migrated across the Atlantic or Siberia. In the first decade of the 21st century, migrant flows amounted to about 1.2% of the world’s population.

But this was just the start. Global demographic trends point to a dramatically rising demand for migrants from the world’s richer countries. Europe will see its population decline by about 150 million people over the next century, not far off the one quarter drop between 1300 and 1400 as a result of Black Death.

But it isn’t only Europe in this situation or even just the richest countries. Upper-middle income China is facing a demographic cliff. The working age population in the country will fall by 160 million between 2020 and 2050. By the 2040s or 2050s, Brazil, Thailand, and Turkey will also start shrinking.

Number of children, working-age adults, and elderly people in China over time, including future projections. Data from Our World in Data.

The impact on workforces has already begun. As recently as 2008, high income countries were adding 6 million people to the working-age population each year. From the mid 2020s, they will lose 2 million a year. Add in upper-middle income countries, and that climbs to losing 10 million workers a year by the 2030s. These missing workers do not immediately disappear; rather, they retire. And retired people will continue to demand goods and in particular nontradeable services like care, even if they no longer produce them. That means they will create demand for work even if they’re not working.

Stagnating or shrinking working-age populations are one significant reason why the last few years have seen stories about worker shortages in farming, healthcare, mining, restaurants, sales, construction, transport, professional Santa Claus actors, daycare, the beer and wine industry, cheesemaking, security, interior decoration, ski lift operation, and zookeeping.

Population decline will be why even politicians elected on anti-immigrant platforms are opening the doors to more migrants. Politics cannot sweep away demographic trends. In Hungary over the last decade, a government publicly committed to not accepting a single migrant has opened up to ‘guest workers’ instead, and immigration rates have climbed dramatically since 2016. Something similar has occurred in Italy. These countries follow in the footsteps of traditionally immigrant-phobic Japan and South Korea to woo migrant labor.

Opportunities for Origin Countries

But population decline is not universal. The working-age population in low and lower-middle income countries will expand by about 1.12 billion between 2020 and 2050, or by about 37 million per year. They will also be the most educated generation in their countries’ history. The proportion of children in low-income countries that have completed lower secondary education has climbed to 38% in 2024 from 17% in 2000, for example. As they enter the workforce, they will want good jobs.

Number of children, working-age adults, and elderly people in Africa, including future projections. Data from Our World in Data.

Ensuring there are such jobs is the secret of turning the ‘demographic dividend’ of a bulging working age population into the kind of miracle growth rates that East Asian countries achieved in the second half of the 20th century. But there is a risk alongside that potential: without more jobs, the dividend could help spark turmoil: the Arab Spring was powered by a young, educated population with nowhere to go but the streets.

And there are fewer domestic opportunities to provide that employment. The traditional development model of rapid growth in jobs and income through manufacturing exports is breaking down. Relative demand for manufactured goods is falling worldwide and global value added in manufacturing exports as a percentage of global output is declining. That’s because older, richer people—like those vanishing from the labor force in rich countries—want services rather than stuff. They need healthcare, not cars. Add in continuing automation, and forecasts suggest there may be about 66 million fewer people working in manufacturing worldwide in 2050 than in 2018. Meanwhile, global services employment (much of it untradeable and difficult to automate – think home care, education, policing, construction, cleaning, and maintenance) might climb from about 1.3 billion in 2018 to 1.9 billion between 2018 and 2050.

This means that the timing of the second demographic transition toward a shrinking workforce in older countries couldn’t be better. Upper income countries need more workers, while lower income countries have workers to spare. Migration is the mutually beneficial solution to this global workforce imbalance.

Benefits of Emigration

Like immigrants in the 19th century, modern immigrants remain deeply connected to their home countries. Remittances are an increasingly large portion of incomes in developing countries, already accounting for a third of capital inflows to those countries in 2022, far more than all foreign assistance combined. Remittances help reduce levels of extreme poverty, pay for healthcare and education, increase savings, and cushion income shocks. And, for about a third of the world’s countries, remittances revenues were more than manufactured export revenues in 2023.

Personal remittances and official development assistance over time. Data from Our World in Data.

But, as it was a century ago, emigration is about far more than remittances. Migration promotes learning, trade and investment.

In the Philippines, the opportunity to migrate and earn as a nurse abroad has been a considerable incentive to stay in school and study nursing: so much so that for each nurse migrant, nine additional nurses were licensed in the country. This ‘brain gain’ effect will be why nearly three-quarters of the long-run income gains from emigration out of the Philippines came from domestic rather than migrant income. The prospect of emigration drove increased education, which in turn increased domestic income.

Similarly, the Indian information technology boom was underpinned by a domestic talent base that expanded in response to the opportunity to emigrate to the US, and then benefited from the contacts and experience of those who had migrated. Sridhar Vembu is one example: he studied at the Indian Institute of Technology – Madras, did graduate work at Princeton, and went on to a career at Qualcomm in the US. He used that experience to found Zoho, a software development company that set up offices in small towns and villages in India, providing customer relationship and project management tools for small and mid-sized companies around the world.

There are many such examples. Migrants with experience in South Korean textile factories returned alongside South Korean investment to launch Bangladesh’s own textile export revolution, while return migrants to Mexico powered a significant shift in workforce distribution toward the manufacturing sector. Refugees who fled the former Yugoslavia and spent time in Germany in the 1990s brought skills back to their countries after the war was over and fueled a knowledge-intensive export boom.

Across the world, countries that have more emigrants in communities in the US see faster trade growth with those communities. Meanwhile, those with more college-educated emigrants in the US receive more FDI from the US, and those with more patent-producing emigrants in the US have seen faster manufacturing growth.

It’s true that the cross-country correlation between emigration and economic growth suggests the relationship isn’t strong on average and may be negative for some countries. This is likely at least partially because mass emigration can be an act of desperation—fleeing violence or lack of opportunity. But a country investing in its future by harnessing the power of emigration is a distinctly different proposition than a failed state in which citizens have no choice but to leave if they can.

And the opportunity is large and growing: indeed, the average country already has an emigrant stock more than twice the size of its stock of manufacturing employees, and existing emigration may already be shrinking cross-country income inequality and global poverty, reducing the number of people living on less than $5.50 a day worldwide by between 67 to 105 million people.

Where’s My Ministry for Emigration?

When it comes to encouraging emigration, the Philippines has set the standard by creating the Philippine Overseas Employment Administration, providing pre-emigration training and certification, and an Overseas Workers Welfare Administration to assist workers and help prevent their exploitation abroad. Some eleven million Filipinos live overseas, and remittances amounted to 9% of GDP.

Other origin countries should follow its example by exploiting the increasing need for workers in rich countries to ensure greater benefits for those who stay at home. This is likely to involve a focus on more migration: not least, signing a bilateral labor agreement is associated with larger flows.

But, to reap the greatest benefits, sending countries need to do more than that. They need to ensure that emigrants have the skills they need to seize the best opportunities they can: not just in farm labor and housekeeping, but also in nursing and IT.

Increasing supply is key to making this work as part of a growth strategy. If the number of skilled workers is fixed, emigration might reduce access to those skills at home. And there is a linked point here about expansion of training to meet the demands of potential emigrants. Since most of the gains from emigration are private rather than public, the associated training costs should also be private rather than public.

Take nursing: in the Philippines, most trainees pay for their education. For-profit nursing schools have expanded to provide that training and the country now has a lot more nurses at home and abroad as a result. To ensure equitable access, countries might provide loans to cover education and training costs, which (in the case of medical staff) could be forgiven if students go on to practice in public hospitals and clinics at home.

As moving abroad is expensive, and many potential migrants have limited access to credit, origin countries could also provide potential emigrants with loans for travel and resettlement costs. And they could also help ease the process by backing domestic university and vocational training curricula that meet destination country standards: for instance, German and Indian education institutions are developing joint nursing curricula.

But as the competition for immigrants—and especially skilled immigrants—heats up, destination countries should themselves be increasingly willing to bear the costs of training. Japan, which has long included training as part of a package offered to emigrants, is improving that package to better guarantee rights, allow flexibility to switch employers, and ban demands for payment to access the training.

Origin countries could also make better use of their returning migrants. Currently, it is all too common for returnees to use their savings to invest in low-productivity, low-growth small enterprises, perhaps because of low skills or few opportunities. Origin countries can help to prevent this by facilitating migration to employment opportunities that will create skills and linkages that can be exploited to create domestic industry. Following the Bangladesh model, for example, if a government wants to encourage textile manufacturing at home, it should help potential emigrants find work in that industry in a destination country with a mature textile industry (preferably at all employment levels).

And origin countries should make it easy for that diaspora talent to return. Taiwan created the Industrial Technology Research Institute (ITRI) to turn the country into an electronics powerhouse. Its early strategies included sending students for advanced courses and employees for training to US schools and companies. Once people were trained to global standards, there were incentives to return to Taiwan. The institute provided housing, health services, and the country’s only public bilingual secondary school to lure talent back. The institute—and its returnees—later spun out both United Microelectronics Corporation (current market capitalization: US$24 billion) and Taiwan Semiconductor Manufacturing (market capitalization: US$1.6 trillion).

But instead, many countries discourage return migration. Some don’t allow dual citizenship, forcing potential emigrants to choose between their new country and their old. Few countries coordinate on social security payments for (potentially) temporary migrants. Both are fixable problems—Morocco, for example, actively encourages return migration by including social security arrangements in its bilateral labor agreements.

Countries can also focus on building out the industries that their existing stock of emigrants already work in. For instance, the Philippines has focused on building its medical tourism industry. If nurses that go abroad wish to return to the Philippines, there are internationally accredited hospitals in which they can work. In 2023, there were already some 30,000 medical tourists in the country.

That said, serendipity plays a role. Consider the example of Fahad Awadh. He left Tanzania as a young child and studied in Canada. He was not a highly skilled immigrant; there was no particular plan that he would be an asset to Tanzania. But, in Canada, he built a clothing brand and learned about sourcing and trade. When he returned to Tanzania in 2013, he used his skills and connections to found and build YYTZ Agro-Processing, which processes nuts and markets them globally under the More than Cashews brand. It sources from 4,700 smallholders, increasing their incomes and customer base. Certainly, agroprocessing is some distance from Awadh’s original experience in clothing. But a larger flow of emigrants increases the chance that these random acts of cross-country entrepreneurship occur.

The first age of mass migration closed with the imposition of migration restrictions in the US and beyond. The second age is beginning as similar restrictions are loosened under the increasingly urgent pressure to find workers. And, like the first age of mass migration, the second has the potential to make the world considerably richer. Luigi Pastene and Luigi Vitelli made migration a tool for Italian development a century ago, and it worked as well today to help Fahad Awadh create jobs and growth in Tanzania, ITRI launch semiconductor factories in Taiwan, and Bangladesh build its textile industry. More developing country governments should seize the opportunity.

Charles Kenny is a Senior Fellow at the Center for Global Development, and the author of Getting Better: Why Global Development is Succeeding and Life, Liberty, and the Pursuit of Utility: Happiness in Philosophical and Economic Thought.

If you have comments on this article, or wish to contribute to the discussion, please email them to letters@indevelopmentmag.com. Responses will be featured in a letters section.

For many years, the first word most foreign visitors learned upon moving to Jakarta was macet, traffic jam.

Traffic was so bad that transport experts warned in 2013 that if nothing was done, the city could achieve total gridlock, with every part of the city experiencing a traffic jam. In 2014, Jakarta was crowned the world’s most congested city by the Stop-Start Index and a year later was ranked far below other Asian cities on livability by the Economist Intelligence Unit.

Ten years later, Jakarta has the world’s largest and one of the most used bus rapid transit (BRT) systems. The old, crowded diesel commuter trains, famous for allowing passengers to ride on the roofs, are now electrified, air conditioned, and run on regular schedules linking the suburbs to the city center. There are multiple subway and light rail lines crisscrossing the city. The transformation has been remarkable: in 2015, less than 20% of residents were within walking distance of transit. Now, nearly 90% of the city has access to BRT or trains.

(A photo of a morning commute in Jakarta, with a dedicated Bus Rapid Transit lane. Image: UN Women, CC-BY-NC-ND)

How did Jakarta go from the world’s most congested city to one that other rapidly growing cities seek to emulate? International investment, political will, and a bit of luck.

Fixing the World’s Most Congested City

It’s hard to overstate how challenging getting around Jakarta used to be. Back in the early 2000s, expats in Jakarta used to joke about taking trips to “more peaceful” cities — like New Delhi, Cairo, or Bangkok.

After all, those cities had urban transit systems. In Jakarta, the only certainty was traffic. During peak hours, it would often take more than an hour to travel just five kilometers. At that speed, walking would be faster, but with no sidewalks in most of the city, even that wasn’t really an option.

There were few buses and no urban rail. According to the Institute for Transportation and Development Policy, the city-run bus system covered only about 10% of the city, and seemed to mainly serve to get you stuck in traffic. Other minibuses were run by private companies or individuals. They took seemingly random routes, stopping on demand, and charged inconsistent fares based on distance and which company ran the bus.

Other options were bajaj (auto-rickshaws) and ojek (motorcycle taxis). There were dozens of companies offering such services and few were reliable. It was possible to be taken on a joyride, or worse. And, according to a 2016 Asian Development Bank report, it was only going to get worse over time — private vehicle ownership was rapidly increasing at some 10% per year. Every year, Jakarta was also adding some 400,000 new residents, and they too had to use the roads.

As a consequence, Jakarta had also become one of the world’s most polluted cities. By 2011, 58 percent of all illnesses among people living in the city were related to air pollution.

And there were few signs of change. A 2013 working paper by the International Monetary Fund (IMF) placed Indonesia as having the worst infrastructure in the region. In 2014, the World Bank blamed the traffic on a “rapidly growing population and poor planning processes,” alongside “one of the lowest percentages of GDP spent on infrastructure” in the world. Residents were resigned to spending an average of 16 days stuck in traffic each year.

What changed?

The then-president of Indonesia, Susilo Bambang Yudhoyono, saw traffic as a concern for city and local governments. In his mind, this was not a national problem; Jakarta would have to fix itself.

The next president, Joko Widodo, known as Jokowi, saw things quite differently. Elected in 2014 after serving two years as Jakarta governor, he began taking steps to improve existing commuter train lines and expand the BRT system. Upon taking office, he branded himself the “infrastructure” president. To him, addressing Jakarta’s congestion was central to making it a world class capital city, and foreign investment, via development loans and technology transfer, would be key.

Just over a year after Jokowi took office, Japan and Indonesia signed an agreement to provide a 77 billion Japanese yen (US$623 million) loan to build a mass rapid transit (MRT) line. While the groundwork had been laid over the previous decade, many credited Jokowi with brokering the agreement. The loan had an interest rate of just 0.1%. Japan would also provide technical expertise for the building process; Japanese train systems are built quickly and efficiently at low cost, and Indonesia hoped to learn from them. Having Japanese and central government oversight would also hopefully reduce corruption.

It was a big risk. Indonesia only had a decades-old colonial era domestic railway network and little rail or railway manufacturing capability. There was no evidence that the country had the capability to implement such a large-scale project, and many expected it to either go over budget, or be heavily delayed. After all, strange pillars still dotted the Jakarta skyline from the last time the city had attempted a similar project. In 2003, construction started on a monorail project in Kuningan business district. That project never got beyond basic pre-construction, the funding either wasted or, as many Indonesians believe, stolen.

(Pillars from the abandoned monorail project. Image: Davidelit; public domain.)

This time, it would be different. Japan would play a role in basic design, construction, and introduction of transportation systems, including trains, signals, and gate systems, as well as their operation and maintenance.

But Japanese contractors were insistent that, while they might build the railway, it was up to Indonesia to run it. Much of the technology would come from Japanese companies like Sumitomo and Nippon Sharyo, but construction, operations, and maintenance would all have to be done by Indonesian companies or the government. “In the future, it will be the local staff of Jakarta MRT who will have to manage this railroad. The Japanese way of doing things will not always be applicable here. For these reasons, we placed an importance on their autonomy when transferring the technology and operation know-how to the local staff,” says Mariko Utsunomiya from Japan International Consultants for Transportation.

For the most part, the MRT was built underground or alongside existing large thoroughfares, minimizing the need for expensive land acquisition. When land was needed, the project used international standards to determine fair compensation and ensure fair process. Still, issues around some stations, particularly in South Jakarta, did result in the deadline being pushed back from 2018 to 2019.

Other than land acquisition issues, the MRT construction went smoothly, and the project stayed within budget. The first line opened in 2019, just in time for Jokowi’s re-election. According to a report in the Indonesia Journal of Social Sciences, the MRT project met most of the requirements of the Paris Declaration, which sets standards for mutually beneficial aid spending, and had a “positive impact on infrastructure development in Indonesia.”

(Ratangga 1000 series LBB12 train on the Jakarta North-South MRT line. Image: Alvin Imanuel; CC BY-SA)

While the MRT was still being built, the central government also approved a plan to have the state railway operator build two Light Rapid Transit (LRT) lines using domestic trains and technology. With knowledge gained from working with Japan, the Indonesian government would try to build its own infrastructure. The first line opened in 2023, slightly delayed by the COVID-19 pandemic but on budget.

The success of the LRT and Phase 1 of the MRT has opened the door to more international investment. MRT Phase 2, also funded by Japan, is under construction and should open in late 2026.

JICA and ADB are funding the MRT Phase 3 East-West Line, and a South Korea consortium, led by the Korea Overseas Infrastructure & Urban Development Corporation, Korea National Railway and Samsung, will build Phase 4 for 21 trillion Indonesian rupiah (US$1.9 billion). By 2045, if all goes to plan, there will be 10 LRT and 4 MRT lines with over 100 miles (160 km) of track added to the network.

“The improvement is quite significant in terms of quantity and network,” says I Made Vikannanda, Senior Manager for Resilient Cities & Transport at the non-profit World Resources Institute (WRI) Indonesia.

The user experience has also been streamlined. All of the new lines are part of an integrated digital fare system. A journey from one end of Jakarta to another is capped at 10,000 rupiah (about 70 US cents). According to WRI Indonesia, as of 2024, 10 percent of trips in Greater Jakarta are now made by public transit, compared to just 2 percent in 2015.

While the JICA loans covered the cost of building the system and training local staff, the full cost of operation has now fallen to the city government. So far, this has worked reasonably well, with Jokowi arguing that the cost of running the system — at about 800 billion rupiah (US$50 million) a year — is justified by the estimated 65 trillion rupiah (US$3.5 billion) in annual economic losses due to traffic.

There are also plans to take what has worked in Jakarta and expand it to other large cities in Indonesia. In 2022, the World Bank approved US$224 million to expand mass transit in other Indonesian cities. It hopes to replicate the success of Jakarta’s system in the metropolitan areas of Medan and Bandung, Indonesia’s third and fourth largest cities. This comes alongside a loan from the French development agency, Agence Française de Développement, to support the development of a Jakarta-style BRT in Medan and Bandung.

Future Challenges and Lessons

Despite making remarkable improvements in the last decade, Jakarta’s public transit still isn’t enough. The city has recently overtaken Tokyo as the world’s largest city, with a metro population of over 41 million people, and it is still growing rapidly. It is projected to add another 10 million people in the next 25 years.

To serve this population, Greater Jakarta has only six train lines and under 250 miles (400 km) of track. Tokyo, by contrast, has an astounding 158 train lines and 2,930 miles (4,715 kilometers) of track connecting 2,210 stations throughout its massive metro area. If Jakarta wishes to serve its population as well as Japan serves its, it would need an order of magnitude more transit.

This has meant that despite the growth in transit ridership, there are still more cars in Greater Jakarta now than in 2019, when the MRT opened. Ride-hailing apps have also exploded in popularity; GoJek and Grab now provide on-demand motorcycle and rideshare to millions of Jakartans everyday. The sheer number of them means that fares are cheap — often just a little more than the train for a ride that requires no walking or transfers.

This means one of the core drivers of the transit development push — air pollution — has actually worsened. Danny Djarum, an Air Quality Senior Research Lead at WRI Indonesia says that PM 2.5, the measurement of inhalable airborne particulate matter, is now eight to ten times higher than World Health Organization guidelines. “We’re still one of the top 5 most polluted cities in the world,” he said.

(Smog in Jakarta. Image: Joe Mud, CC BY-NC-SA)

Other infrastructure has also lagged behind investment in trains. “Sometimes the crucial things like the connectivity or accessibility around the stations, or the first mile/last mile problem, are often forgotten,” said Gonggomtua Eskanto Sitanggang, the Southeast Asia Director at the Institute for Transportation and Development Policy (ITDP), a think-tank . “Aid is good, but it needs more streamlined planning and coordination with the government, so it can take a broader perspective on how we can envision public transport in the future.”

While the city government has made progress on expanding sidewalks, it is limited by a lack of funding and capacity. Large projects, such as train lines, attract multiple foreign bids, but an overpass or better crossing signals do not. Convincing donors that these, too, are important might be the next frontier in improving Jakarta’s built environment.

There is also work to be done on getting people to drive less and use transit more. This could be accomplished through congestion pricing, making drivers pay a fee to enter certain areas. Mandatory car-pooling could also be a strategy. The strategy that WRI is calling for is the designation of Low Emissions Zones, LEZ, where access by private vehicles is restricted, green space is expanded and walkability improved. The city has, in fact, run a small-scale trial in the touristy “old town” (Kota Tua) neighborhood. While too small to have a measurable impact on air quality, residents and businesses observed improvements in safety and social inclusion, and reduced noise and air pollution.

“The best way that we can reduce the emissions emitted from the transportation sector is to have LEZs at a much larger scale,” says WRI’s Djarum.

Most cities that have embarked on demand reduction programs are in richer countries. Singapore has an electronic road pricing system, New York City has congestion pricing, and Paris has a highly regarded expansion of walk- and bike-only streets. It’s another chance for Jakarta to show a path forward for the tens of millions of people living in crowded, congested cities in Asia, Africa, and Latin America.

After all, Jakarta has already done the hardest part. Government and external donors have shown they can coordinate to improve the urban landscape. Jakartans are proud of the improvements and believe that their city can make even greater progress. In the latest TomTom traffic index, measuring average congestion—the percentage increase in travel time compared to free-flow conditions— the city ranked 24th, just ahead of the United States’ most famous traffic clogged city, Los Angeles.

Nithin Coca is an award-winning, Asia-focused freelance journalist who covers politics, technology, human rights, and environment, across the region, with a focus on cross-border, collaborative reporting. He is currently based in Japan, but was previously based in Jakarta, Indonesia.

If you have comments on this article, or wish to contribute to the discussion, please email them to letters@indevelopmentmag.com. Responses will be featured in a letters section.
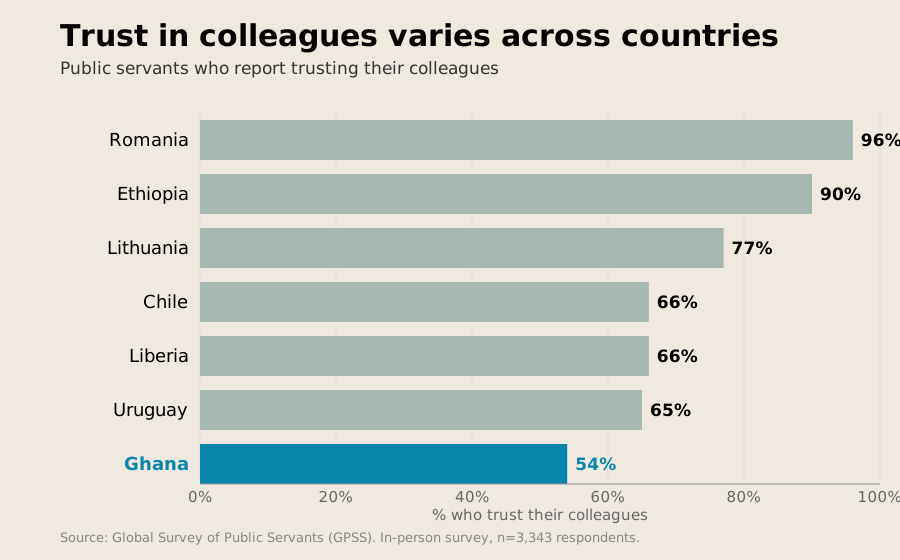
A successful commercial firm does something no NGO can.

June Jambiha was a quintessential hustler. Like many in Kenya’s capital of Nairobi, she sold clothing as an informal entrepreneur, her income in 2018 swinging wildly, from $400 one month to $60 the next. This uncertainty made it nearly impossible to plan: hard to save, borrow, or commit to anything beyond the next week. But in Kenya, where over 80% of jobs are informal, hustling was less a choice than the only option available.

June joined my company, Wasoko, a B2B e-commerce platform linking small shops to large manufacturers, as a telesales agent. Her starting pay was lower than her best month selling clothing, but, for the first time, it was predictable. She knew what would land in her account the following month and the month after that. More than the money, though, there was an upward trajectory: her career could grow. Joining Wasoko didn’t just give June a paycheck; it gave her a career.

Entrepreneurship by Default

In developing countries, many people become entrepreneurs by default. Most have informal, cash-in-hand jobs. There is no certainty in entrepreneurship. At any given time, there could be a glut of opportunities, or income could completely dry up, and individuals have little control over this. When your income can differ markedly from month to month, it is hard to plot a path forward. Should you take out a loan to grow your hustle when your income could disappear the following month?

People in wealthier countries rarely stop to think about what a regular paycheck actually provides. A few prefer the adrenaline rush of building something of their own, but most, given the choice, prefer a steady job, since housing payments, credit cards, and expected bills are all far easier to manage. A paycheck is a reliable inflow that lets you build a future, not just get through the month.

People in poor countries share those preferences. As highlighted by Abhijit Banerjee and Esther Duflo in Poor Economics, these individuals do not necessarily want to be hustling; they simply have no choice. There are not enough steady jobs to be had.

To lift the floor for the 800 million people living on less than $3 a day, we don’t need more projects; we need more payrolls.

Effective Entrepreneurship

Non-governmental organizations often try to limit the damage from this massive deficit of employment opportunities. Cash transfers can allow people to invest productively, and asset transfers mean that people do not have to save for those purchases. But NGOs are inherently limited by the generosity of donors. What if there is a better option?

A successful commercial firm does something no NGO can: it issues “cash transfers” to a large group of people every month, indefinitely, funded by the market rather than donor whims. Indeed, private sector growth is the key to the structural transformation required to create hundreds of millions of jobs. No rich country today has become wealthy through the intervention of NGOs.

Rather, it is businesses that make a country rich. Take Singapore as an example. It became an export hub, first in goods and later in services. As the private sector grew, the state had more money to invest in public goods and advanced infrastructure, enabling further private-sector growth. Growth laid the foundation for everything else.

All of this can feel like a task for governments and economists—structural transformation is an initiative too large for any one person to shape, right? That assumption is wrong. Firms don’t emerge from policy; they are built by founders. You could be one of them.

I started Wasoko in Kenya in 2015. The seed of the idea had come from a month spent living in a rural village in Egypt a few years earlier, where I was doing remote coding work while learning Arabic. What I kept noticing was a simple, persistent problem: the neighborhood shops kept running out of basic items, such as soap, cooking oil, flour, and sugar. The shopkeeper then faced a half-day trip to the nearest city’s wholesale market to restock, at a significant cost in time and transport.

A small shop in Egypt with smiling shopkeeper
A typical small shop in Egypt. Photo by Joseph Bautista; image under Creative Commons BY 2.0 license.

Wasoko replaced that trip with a mobile phone order and same-day delivery. By consolidating dozens of individual restocking runs into a single route—one driver, one truck, serving many shops—the marginal cost fell significantly for each shopkeeper. What had once taken half a day and eaten into thin margins could now be done on the phone in two minutes.

Wasoko eventually grew to serve more than 100,000 small businesses across six countries in Sub-Saharan Africa, with a team of 2,000 people. Most held entry-level logistics and customer support roles—the vital first rungs of the formal economy. Each drew a monthly paycheck; that payroll helped support the lives of more than 10,000 family members. Those paychecks paid school fees, covered medication, and funded improved housing.

My experience at Wasoko is just one data point in a larger argument. Scale-up entrepreneurship—moving from the startup phase to manage increasing complexity and growth—is not merely a business strategy; it is the most powerful engine of mass job creation and poverty reduction ever built. All countries start with informal economies; the transition to an advanced economy happens one firm at a time.

Creating Firms in Poor Countries

Starting a business in a developing country means confronting a hard ceiling almost immediately. Most potential customers are poor. While you can build something genuinely useful and serve real demand, you can still find your growth fundamentally capped by local purchasing power—the very condition you set out to change.

But there is a way around this, by focusing on exports. By selling to global markets, firms bypass the constraints of domestic purchasing power entirely to access demand that is effectively bottomless.

This is what economist Dani Rodrik calls an “unconditional escalator.” Unlike domestic-facing firms, whose growth depends on rising local incomes, an export firm can scale as far as global demand will take it—in principle, until every willing worker in the country has a paycheck. This is roughly what China did when it became the manufacturer to the world. In the 1990s, Chinese consumers were too poor to support demand for their own sprawling manufacturing industries, but American consumers were eager to buy cheaper Chinese goods. In time, the employment gains made the average Chinese citizen much richer.

But the gains go beyond employment. To compete in global markets, a firm must meet international quality standards and benchmark itself against the world’s best—driving productivity levels that domestic industry rarely needs to reach. This is how a country climbs the complexity ladder: not by protecting local champions, but by forcing them to compete.

This was the scale logic of the “East Asian Miracle,” the rapid economic growth and industrialization, along with significant poverty reduction, in eight economies in the 40 years to 1990. Countries like Singapore, South Korea, and Thailand did not achieve historic poverty reduction through domestic services or aid. They did it by investing in manufacturing. By starting with low-complexity exports like textiles, they built the organizational muscle and fiscal surplus to move into higher-value industries. Each export factory served as a school of management and engineering, creating a self-reinforcing cycle of wealth and skill.

The organizational capital created within these pioneering firms eventually “spills over” into the broader economy. As people move on from the first scale-up firms, they take their knowledge with them. Economists Ricardo Hausmann and César Hidalgo argue this vital “productive knowledge”—the collective ability to perform complex tasks—is rarely found in textbooks; it must be acquired through learning-by-doing within functional organizations.

There are legions of historical examples. Consider Floramérica, the first cut-flower exporter in Colombia. Floramérica was founded by a few Americans in their early thirties who brought US-style business management to their pioneering venture. Within six months, they were exporting to the US and, within three years, employed 400 people.

But Floramérica didn’t just grow flowers; it engineered a multinational cold chain from scratch. It negotiated with airlines to create cargo space, designed specialized refrigerated trucks to navigate Andean mountain roads, and mastered the stringent plant import standards of US Customs. This required a level of organizational knowledge that Colombian domestic business did not have at the time. By solving these complexity problems, it created a high-productivity blueprint for an entire nation.

The knowledge didn’t stay inside Floramérica. Local employees mastered the trade and left to launch their own ventures, seeding an entire industry. Today, Colombia is the world’s second-largest flower exporter, with an ecosystem generating US$2.4 billion in annual value with 200,000 formal jobs as of 2025.

cartoon of a lemonade stand setting up franchises

It is difficult for an NGO to compete with that level of impact. This outcome was achieved through entirely different mechanisms outside of standard aid practices: The founders of Floramérica didn’t write policy papers, disburse cash transfers, or run a randomized control trial. They built a scale-up business in a poor country selling to global markets. In so doing, they catalyzed the structural transformation that gave hundreds of thousands of people exactly what June Jambiha spent years looking for: a reliable paycheck and a path forward.

And it’s repeatable. One of the Floramérica founders, Thomas Kehler, went on to launch SalmoAmerica in Chile—one of the first salmon exporters in what is a $6.5 billion industry employing 86,000 people in the country as of 2023.

Does This Still Work?

A common objection to export-led growth is that commodity prices are volatile: a nation that builds its economy around coffee or copper can be devastated by a price crash. This concern is real, but it misidentifies the target. Raw commodity exports are often capital-intensive rather than labor-intensive. They concentrate wealth in a few hands and can generate perverse incentives such as “Dutch disease,” where resource windfalls crowd out other productive sectors, or corrupt the elites who hoard outsized resource profits. The answer is not to avoid exports altogether, but to focus on value-added, labor-intensive manufacturing. A garment factory or food-processing plant prices its output primarily against the cost of entry-level labor, which is far more stable than iron ore or arabica futures. It is also precisely this kind of production that generates the broad-based employment that lifts living standards across a society.

A related worry is that the era of export-led industrialization is closing. With tariffs rising, there are significant efforts to relocate manufacturing closer to home, and manufacturing’s share of global value-added output is lower today than it was two decades ago. Is the window for the remaining poor countries to industrialize closing too? The window may be narrowing—but the alternatives are worse. For any developing country, the question is not whether manufacturing is growing as a share of global GDP, but whether there is room on the escalator for new entrants. There is: China’s share of global apparel exports peaked at nearly 37% in 2010 and has since fallen as wages have risen. Bangladesh’s share of global apparel exports has increased from 4.2% in 2010 to nearly 7%, while Vietnam’s more than doubled from 2.9% in 2010 to just over 6% as of 2024 World Trade Organization reporting. Both countries followed the same path: their lower wages attracted the labor-intensive industry while building general organizational capacity, while China’s rising wages pushed the lowest-complexity production onward to the next location.

Garment workers in a factory in Sri Lanka. Photo by ILO; image under Creative Commons BY-NC-ND 3.0 license.

Vietnam and Bangladesh are themselves now traveling up the escalator: Vietnam’s electronics exports now surpass its garments while Bangladesh is pushing into higher-value textiles and luxury apparel. The entry-level production that built their export sectors is moving again. Sub-Saharan Africa, with the world’s youngest workforce and wages below those that drew investment to Southeast Asia a generation ago, is the most logical next address. The alternative—betting on domestic demand—remains a structural trap: you need rising incomes to grow demand, but you need demand to raise incomes. Exports break the cycle.

Still others worry that manufacturing automation will make mass employment in the sector a thing of the past. As robotics gets cheaper and more capable, developed countries could reshore manufacturing entirely, closing the window for developing nations before they have climbed through it. This is a serious eventuality and should not be waved away.

But the economic forces driving advancements in robotics should be examined against the conditions for entry-level manufacturing. The robotics deployments that have transformed manufacturing over the past two decades have been concentrated almost entirely in high-precision, high-cost production—automotive assembly, semiconductor fabrication, aerospace components—where replacing expensive skilled labor makes compelling economic sense. The entry-level manufacturing that developing economies rely on sits at the opposite end of the spectrum: handling soft, irregular materials with low-cost labor in fast-changing production runs has attracted comparatively little capital investment. The dexterous manipulation of malleable, unpredictable fabric remains one of the genuinely unsolved challenges in robotics. Even where automation is technically feasible, the economics of deploying it against a workforce earning $65 a month remains deeply unfavorable—robots have high fixed costs, must be retooled for different product lines, and, as orders fluctuate, cannot flex up or down the way a human workforce can. Human labor in physical manufacturing may eventually be made redundant, but even apparel manufacturers in China today still rely on human tailors to drive their production. 

Furthermore, other growth paths besides manufacturing face even stronger headwinds. Tradeable services exports look like an increasingly bad bet. Public companies in service-driven export industries such as business process outsourcing have seen their share prices fall by as much as 70% following advancements in leading artificial intelligence companies. So far, manufacturing has been immune to this; collective market intelligence suggests that widespread reshoring across industries through extremely low-cost automated production remains beyond the forecastable window of cash flow impacts. 

But there is another category of objection altogether. Is this neo-colonialism, and who is an outsider to reshape an African economy? But this critique misunderstands the mechanism. Export entrepreneurship in developing markets is not about arriving with answers to problems you don’t understand. You—the prospective founder—may not have particular expertise in a specific low-income market. But you don’t have to. Your comparative advantage can come from deep knowledge of high-income buyer markets to build a bridge between local production potential and global demand. 

A founder who understands what a European retailer or American distributor needs from a supplier, and who can help a Ghanaian or Kenyan manufacturer meet those standards, is not imposing. The goal is not to serve as an extractor of basic materials from poor countries, but to start businesses in poor countries selling to new global customers who had never bought anything from there before. Eventually, firms started by local people you trained or inspired will probably outcompete you—and that’s the real win. The rising tide of growth brings gains to many people: the workers who will earn formal wages for the first time, the local entrepreneurs who will start the next generation of firms for global customers, and all the new local businesses that will form as they spend their wages.

Founder’s Journey

This is not an easy path. It is for the ambitious; those who want the highest impact and are unafraid of getting their hands dirty. Export-driven growth firms are gritty, capital-intensive businesses defined by physical logistics and hands-on operations. There is no startup accelerator like Y Combinator for garment factories, but success has the potential for far more societal uplift. A B2B software-as-a-service company may be the best job creation mechanism in Silicon Valley, but in Tanzania it is definitely not. These unglamorous industries are precisely those that pull people out of poverty at scale. They provide formal employment to workers who have never had steady paychecks and help countries gain access to the unconditional escalator of global demand. Your potential impact is limited only by the global market.

Success begins with initiative and immersion. As a software developer who grew up in California, I had no prior awareness of the supply chain challenges of small shopkeepers before my time in the rural Egyptian village after a university exchange program to study Arabic. I returned to my second year of undergraduate studies at the University of Chicago with an idea: what if small shops could instead reorder inventory by text message? I entered the concept into a university business plan competition and won a $10,000 prize. That recognition and modest starting capital gave me what I needed most: the means to justify a leave of absence to my parents and the runway to build out an initial prototype of the envisioned system.

I cold-emailed consumer goods brands across emerging markets, pitching the concept to anyone who responded. After months of dead ends, there was interest from an unexpected quarter: the Kenya office of Wrigley, the global purveyors of Juicy Fruit and Doublemint chewing gum. Following the suggestion of a potential pilot, I bought a ticket to Nairobi two weeks later and spent several months riding along on delivery routes with their local distributors, coding in the evenings to update our fledgling platform for presentation at the next Wrigley management meeting.

Daniel Yu speaking to Nairobi shopkeepers
Daniel Yu presenting early versions of Wasoko systems to Nairobi shopkeepers and Wrigley staff in 2015. (Image: Daniel Yu.)

That on-the-ground education shaped everything that followed. We launched what became Wasoko as a simple SMS-ordering service: lean, low-tech, and grounded in what we had actually seen. But the market quickly imposed a harder lesson: a platform that merely connects buyers and sellers is worthless if delivery is unreliable. To provide real value, we had to own the full supply chain. We built our own logistics, managed our own inventory, and became a fully integrated B2B platform. This is the opposite of what the typical asset-light Silicon Valley playbook would have prescribed, but it was the only approach that actually worked. In markets where the infrastructure doesn’t exist, you can’t outsource it. You have to build it.

That meant starting from nothing and scaling through the unglamorous middle. Our first warehouse was a two-bedroom apartment, emptied out and stacked floor-to-ceiling with chewing gum and soap. As volumes grew, we moved to a house with a yard large enough for shipping containers, which we packed with inventory as we expanded capacity. Eventually we operated a network of industrial facilities across six countries, shifting hundreds of millions of dollars worth of goods. The progression sounds logical in retrospect; at the time, it was improvised, one problem at a time.

There were other challenges. We were hiring for roles with no established talent pipeline, in markets where professional norms were still forming. How does one hire a head of product when that job doesn’t yet exist in the market? The first person we did hire did not show up on his first day. He was unreachable for three days, then resurfaced with a relaxed explanation: he had gone away for a family event, and in any case had decided not to leave his existing job. We eventually put together an exceptional team, made of people like former-hustler June Jambiha, but it was by a process of trial and error. 

Country expansion was no smoother. When we entered Rwanda, new suppliers demanded upfront cash before releasing goods. I went to our local bank branch to withdraw the equivalent of $10,000 in Rwandan francs—and discovered they held only $1,500 in local notes. I ended up on a motorcycle to the national branch in the capital city of Kigali, returning with two large bags of cash to close the deal.

But it was worth it. By the time I left the firm, it was serving 100,000 small businesses. After my nine years of living in and scaling the business across six African countries, Wasoko completed Africa’s largest-ever tech merger with MaxAB, an Egyptian e-commerce firm, poetically bringing me full circle back to Egypt.

And as for June Jambiha, within a year of joining Wasoko she was promoted to local team leader, and by five years later she left to co-found a consultancy with former colleagues to help the next generation of East African businesses improve their sales and operations.

Beyond Wasoko

Through that decade of venture building in Africa, I came to understand a harder truth: the path to widespread prosperity would not come from simply helping local businesses operate more efficiently. Wasoko was a start, but local purchasing power was deeply constrained. Creating genuine engines of income growth requires businesses built to serve markets beyond developing countries—using global purchasing power to drive convergence.

That conviction is what brings me back to you. If you want to improve livelihoods across the world, I would push you not towards Silicon Valley or the UN, but to the factory floor.

Start with radical immersion. If you lack a network in your target market, offer to work for free; local entrepreneurs are rightly skeptical of unproven outsiders. Spend at least six months working for a local export business, learning to navigate regulatory thickets, building supplier trust, and absorbing the nuances of the business culture. This is the most valuable capital you can acquire, and it cannot be found in a policy brief or a business school classroom.

Then build small, test rigorously, and commit to the long haul. Export-led ventures require a multi-year horizon; dabbling in actual development does not work. Study what succeeded in Asia and apply those lessons to the untapped comparative advantages of your chosen market. Most enterprises in low-income countries today serve protected local markets; the frontier is in helping them compete globally.

This path will likely never put you on a stage at the World Economic Forum in Davos. You won’t have a diplomatic passport and your work will probably be invisible to the global aid industry. But consider what the world actually needs: not more development consultants, but more exporters without borders—people willing to trade the conference circuit for the factory floor, who go to places where formal employment barely exists and build the supply chains that bring it into being. In the long arc of human history, development has never been a product of charity. It is built by those who go forth and export.

Daniel Yu is the founder of Wasoko, one of Africa’s largest e-commerce companies, and now the founding partner of the Africa Jobs Fund, a new program under Renaissance Philanthropy to finance and build African export manufacturing and labor mobility pathways.

If you have comments on this article, or wish to contribute to the discussion, please email them to letters@indevelopmentmag.com. Responses will be featured in a letters section.
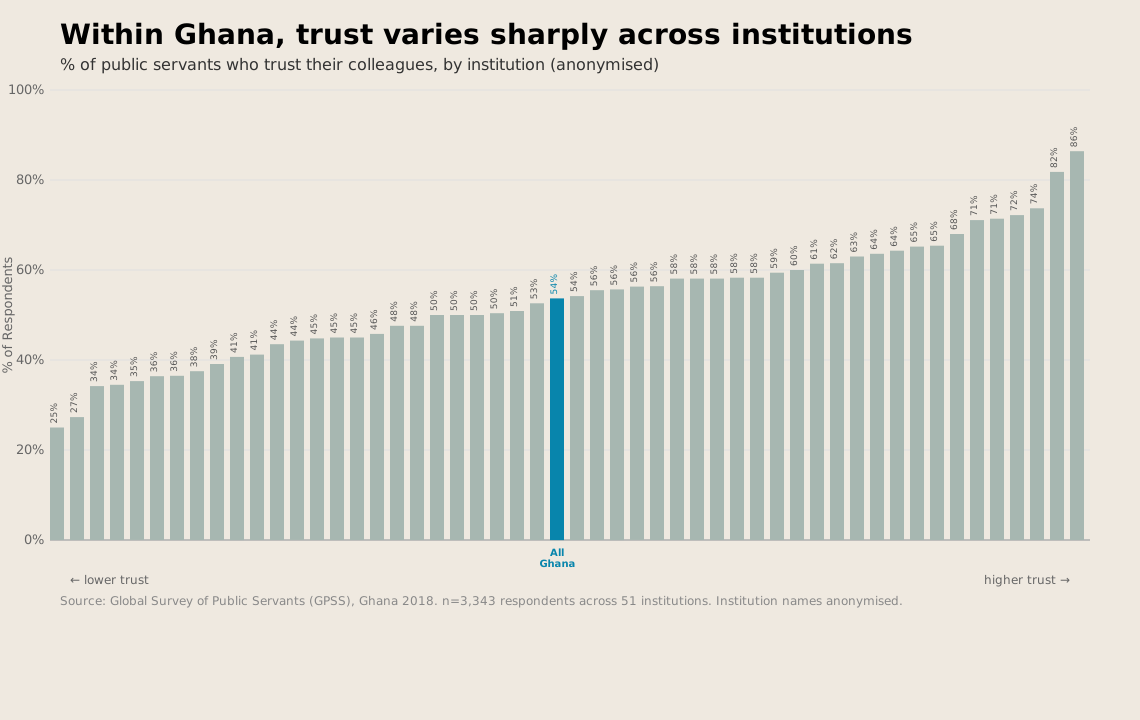
Is it nuts to give cash to the poor without strings attached?

That’s not a rhetorical question; it’s the headline the New York Times ran the first time they covered GiveDirectly. My co-founders and I had a mild panic. We had been hoping, I suppose, for something benign and puffy along the lines of “New Charity Founded by Thoughtful Econ PhDs Is a Great Idea.”

The truth is of course that that piece did what it needed to do, which was to speak to its audience where they were at. At the time (i.e., in 2011) most New York Times readers probably did think it was nuts—or, at best, naive—to give out money for nothing. And one can hardly blame them. They had been fed a steady diet of data-free, mantra-heavy messaging implying, if not stating outright, that people living in extreme poverty were not capable of sound financial choices. One must teach a man to fish, the inane aphorism goes.1

Photo from GiveDirectly; photo of Liberia (Maryland Country) field office

Since then, opinions—professional opinions, at least—have swung. Giving away money without strings attached is seen as a good option, often the best. A 2024 position paper by the United States Agency for International Development (USAID)—prior to its untimely demise in 2025, the largest of the bilateral donors—said that the agency “should include direct monetary transfers as a core element of its development toolkit.”2 The stated policy of the UNHCR, the UN Refugee Agency, is a “‘why-not cash approach,’ whereby operations must give [cash-based assistance] priority consideration over in-kind assistance.”

Priority consideration has not yet translated into majority market share. But numbers are up: cash transfers (and vouchers) were 20.6% of international humanitarian assistance in 2022, up 50% from five years before. And during the pandemic, when governments needed to deliver urgent help at massive scales, they turned to cash transfers en masse, reaching up to 1.4 billion people.

Private donors need more convincing. In 2023, U.S. individuals and foundations gave over $30B to international development work.3 Of that, just 0.5% went to GiveDirectly—the only sizeable nonprofit doing what we do, enabling donors to send money directly to households living in extreme poverty.4 Cash transfers’ relative share of this market, in other words, is very small. Yet it has grown enough that we have been able to raise and deliver over $1 billion to over 2 million people.

One way to tell GiveDirectly’s story is thus as a bellwether for evidence-based decision-making. To win over skeptics we invested heavily, as I will describe, in causal evidence. And we benefited from the growth around us of an ecosystem that took that evidence seriously. If even a nutty idea like giving away money for nothing could survive and thrive in this environment, this bodes well for other efforts to elevate evidence over anecdote.

But there is more to it than that. Part of the point was to provoke questions not just about how to spend development dollars, but also about who should spend them. Questions, that is, about the allocation of power and not just its optimal exercise. From this point of view it was not so obvious what role program evaluation should play. If the money really is for nothing—free not just of strings, but of any particular sought-after result—then what exactly should one evaluate?

Experimental research can, in fact, still be useful even in this regard. It can because of a key difference between experiments in the social as opposed to the physical sciences. When Sir Ronald Fisher pioneered experimental methods at the Rothamsted Experimental Station, one of the world’s oldest centers for agricultural research, in order to figure out which fertilizers or seeds worked best, his “subjects” had no ethically significant agency: they were plants. But the subjects in a cash transfer experiment do. When a researcher documents the choices they make, we learn something about their preferences, their priorities, their vision of a good life. These insights have no analogue in a purely technical matter like agriculture productivity. And they have been an essential part of the story.

Cash transfers and causal evidence

As a point of departure I will lay out an argument an economist might make for giving money to people living in extreme poverty.

It starts with the observation that a dollar is worth much more to them than to us. To illustrate magnitudes, suppose we take a utilitarian view of things, and that we believe the relationship between utility and earnings is roughly logarithmic. This means, for instance, that doubling someone’s income—be it from $1 to $2, or from $100,000 to $200,000—always yields the same utility gain. This is a conservative stance relative to the available measurements of wellbeing, as I read them.5

We can then compare the marginal utilities of people at different initial income levels. Specifically, at the $2.15-per-day international poverty line and at, say, the $170 per day taken home by an average American full-time worker. The implied ratio of marginal utilities is 80, meaning that an incremental $1 increases wellbeing by 80 times as much at the poverty line as for the average American.6

Admittedly, such ratios feel abstract. Stumping for GiveDirectly made them feel a bit less so. My co-founder and I met one afternoon with a potential donor in his opulent corporate citadel in Dubai, dining afterwards at the Burj Khalifa, where the choreography of the water fountains outside synchronizes with the muzak within. Then, on the following morning, we met with potential recipients in a dusty fishing community on the outskirts of Karachi, including one woman nearing her death to tuberculosis. One can think of extreme ratios of marginal utilities as saying that the world would be better if we exchanged some synchronized water fountains for fewer TB deaths.

The second factor is that people living in extreme poverty typically face lower prices than we do. Among the 26 countries the World Bank currently classifies as low income, which collectively contain 44% of the world’s extremely poor people, the median ratio of the nominal exchange rate between local currency units and US dollars to the corresponding purchasing power conversion factor is roughly 3.1. If you don’t care to whom utils accrue, this creates an opportunity for arbitrage. You can triple the bang you get for your buck.

Multiplying these factors together we get, as an overall estimate, that transferring a dollar from a typical American to a typical person living at the extreme poverty line increases its value in terms of aggregate human well-being by a factor of 248. That’s a lot! Most of us would feel good if we could merely double our money by investing it prudently over the course of a decade. Here we have an opportunity to increase its value by a factor of 248 in a matter of weeks.7

And yet for most people this argument is insufficient. Most worry about what people will do with the money once they get it. We expected this, in those early days at GiveDirectly. So we saw no way forward without good, hard evidence.

The question was whether we needed to produce that evidence ourselves. Governments in South and Central America were already running large conditional cash transfer programs and, in many cases, measuring their effects using randomized controlled trials (RCTs). The results as we read them were broadly “positive” in that recipients spent money on reasonable-seeming things—investment as well as consumption, for instance—and that various indicators of well-being improved. Indeed, this evidence was one of a few things that had convinced us to begin in the first place. Would yet another RCT really be any more convincing?8

We ultimately decided to run one as a matter of principle. Any non-governmental organization (NGO) asking for donations ought, we felt, to run an RCT if it could, as a sort of due diligence. Running one would be a statement of intent. It would show that we planned to do things the right way, and not market the idea on the basis of cherry-picked success stories.

It almost didn’t happen, even so. It almost died in—of all places—ethics review: Harvard’s Institutional Review Board worried that giving people money might harm them. This put us in a Catch-22: we had to argue that transfers would not have bad effects in order to justify a study to find out what effects they would have. Eventually, after months of delay, we prevailed.9

It was worth the struggle. Transfers turned out to have a variety of positive effects, from reducing malnutrition to stimulating business investment to enabling people to build more durable homes. They did not increase spending on “temptation goods” like alcohol or tobacco. The study documenting these impacts has been influential among economists (cited nearly 1,900 times). And it has been influential for GiveDirectly—helping to earn a series of top charity recommendations from GiveWell, for instance.

So we carried on. At this time, we’ve completed or initiated 24 RCTs. We’ve come to see conducting—and not just citing—experimental research as a core strategy. It differentiated us. And it let us fuse research with direct impact to create an attractive risk-return profile. Worst case, your money substantially improves the lives of some very poor people. Best case, the evidence this yields also changes other people’s minds.

Conducting research while also doing good in the world is not always an obvious combination. There is a perceived tension between what is “of interest to academics” and “of practical value.” That perception has roots going all the way back to the 1940s, and to American engineer and administrator Vannevar Bush. Bush, the great advocate for public research funding, suggested that we envision research problems on a spectrum, from “basic” to “applied.” He then argued that many important basic questions were too far from commercialization to be taken up by the private sector. His latter, essential point was entirely right. But the uni-dimensional map of the problem space he invoked in making it was too simplistic: some questions, as Donald Stokes has argued, are important both practically and conceptually.

Take the indirect, or “general equilibrium,” effects of transfers. What happens when many people in a village receive transfers? Do prices go up? Are the transfers less valuable? Potential donors often asked us about this, and reasonably so. The question mattered practically.

But academics were also interested in this question. It connects with a classic idea in development economics that one could have a demand-led “big push,” where a big enough increase in purchasing power makes it worthwhile for businesses to make investments they otherwise would not. And answering it let us produce the first experimental estimate of a “transfer multiplier,” a quantity macroeconomists often estimate to try to calculate the effect that government transfers (such as welfare payments) will have on total economic activity, or GDP.10 This is why the general equilibrium study we ended up running succeeded academically, as well as being useful for GiveDirectly. Indeed, it won one of the more prestigious awards an economics paper can.

Or take basic income. In the late 2010s, Universal Basic Income (UBI) was having a moment. Google searches for the term increased nearly eight-fold between January of 2016 and January of 2017. A swathe of GiveDirectly’s target audience were probably going to form their initial views about cash transfers writ large based on what they heard about UBI. But the pilots getting media attention at the time were small-scale and questionably designed, far from what we would consider a reasonable test.11 Running a better one ourselves seemed requisite almost as self-defense.

But it also addressed an economic question. When you give away money you can structure it as either a stream of small payments, or as a few big ones. GiveDirectly had usually done the latter, but UBI involves the former.

We’d chosen to focus on making a few big payments for three reasons. One was the descriptive evidence that accumulating lumps of capital is otherwise hard for people near the poverty line. This makes it hard to start a business or make other productive investments, because these often require a large lump-sum purchase. A large transfer also enabled these larger purchases. Another was that they earn higher rates of return on their investments—in small businesses, agricultural inputs, housing, and so on—that we do when we keep the money in a bank or brokerage account. This means that keeping money on our books while we wait to transfer it to them is inefficient. And a third, perhaps reflecting the first two, was that when we asked people what they preferred, they almost all wanted lump sums. Yet for all that, we had never convincingly compared the impacts of the two. When we did, the results surfaced a lot of interesting economics—including the fact that UBI recipients often formed savings clubs to “reverse-engineer” their streams of small payments back into lumpier ones.

In short, setting out to solve what Bush might have called applied problems has often led to more basic scientific insights. As a result GiveDirectly studies have published in many of the top economics journals—including (if the names mean anything to you) the American Economic Review, Econometrica, Review of Economic Studies, and Quarterly Journal of Economics—even though in no case was publication in a top journal the goal.

And our research-led strategy seems to have worked. In 2025 GiveDirectly delivered its billionth dollar. Raising that money has consistently cost $0.05 or less per dollar raised—a low figure by industry standards. Some donations have come from people whose first reaction was “at last!” But many have come from people whose first reaction was “this sounds nuts”.

Of course, we had help. GiveWell, the first outfit to publicly and systematically assess charities on the basis of causal evidence of their programs’ impacts, launched in 2007. In 2012, they endorsed GiveDirectly as a top charity. In 2010, USAID launched Development Innovation Ventures, a program to find high-impact development interventions. It would eventually support GiveDirectly’s benchmarking collaboration with USAID. There have been new evidence-based funders: Good Ventures, which would account for a large share of GiveDirectly’s early funding, launched in 2011, and The Life You Can Save, which would consistently promote GiveDirectly, launched in 2013. Google.org took an increasingly data-centric approach, backing some of GiveDirectly’s boldest bets. All of this occurred during an ambient rise in the appetite for experimental evidence and the randomista12 turn in development economics, for their roles in which Abhijit Banerjee, Esther Duflo, and Michael Kremer were recognized with the 2019 Nobel Prize. Today, the ecosystem looks far friendlier to evidence-based strategies than it did when we started.

We also benefited from the sheer volume of cash transfer randomized control trials (RCTs). We could point to a much larger and more robust evidence base than we could have produced on our own. I think this helped us escape a “winner’s curse.” When there have been only a few studies of a new idea, it will often look either better or worse than it really is. Momentum—and hype—build behind the good-looking ones. But this means that as more studies come out there is likely to be some mean reversion — where subsequent studies estimate effect sizes smaller than previously expected — and some disappointment. Microcredit arguably suffered from this boom-bust dynamic.13 Cash transfers were comparatively fortunate; the evidence base grew fast enough that the hype never got as far out in front.

From evidence to empowerment tool

Causal research can certainly help those who already have power, such as the power to choose what to fund, exercise it more effectively. But can it also influence the allocation of power? Can it meaningfully empower the people it studies?

Historically, development work has seen fairly little “empowerment” in the sense I mean here, i.e. real transfers of decision-making rights.14 There has been a bit of budget support to national governments, true, and some funding to local bodies a la Community-Driven Development.15 But individual people living in extreme poverty have certainly had little direct say. Money was spent on their behalf, but not at their behest.16

Photo from GiveDirectly; Benta, Kenya 2018

You see this power dynamic reflected in the research. It is so ordinary that it goes unseen: research that hopes to inform important decisions is addressed to the people with the power to make them, i.e. funders and policy-makers. A program evaluation paper might open, for instance, by taking as motivation the fact that policy-makers want to make some outcome go up.

Gunnar Myrdal once observed something analogous about why economists began studying development—as opposed to the wealth of wealthy nations—in the first place:

“The direction of our scientific exertions, particularly in economics, is conditioned by the society in which we live, and most directly by the political climate… Rarely, if ever, has the development of economics by its own force blazed the way to new perspectives. The cue to the continual reorientation of our work has normally come from the sphere of politics; responding to that cue, students turn to research on issues that have attained political importance.”

The same goes for valuation. One cannot evaluate without valuation; there is no way to determine how good an intervention is without taking a stand on how to measure the good. These days the usual way is by asking whether an intervention can inexpensively increase an outcome that policy-makers want—i.e., cost-effectiveness analysis. Economic welfare analysis, in contrast, requires that you ask how the intervention affects various people’s wellbeing as they themselves see it. This is harder to do, and perhaps consequently, you see less of it.

A concrete example may sharpen this distinction. Consider sending SMS messages to families encouraging them to feed their children nutritious meals, and take them for regular check-ups. If this “works,” it will induce both benefits and costs. If families spend more money on food for children, they must spend less on something else. If they visit a health clinic more often, some of that clinic’s capacity cannot be used for something else. Welfare analysis pushes us to consider how to value such things, whereas a typical cost-effectiveness analysis might simply observe that child health improved a lot relative to the negligible cost of sending SMS messages.17 This is not the whole story—but it is what matters from the narrow point of view of a technocrat tasked with improving child health.

Our ecosystem is prone to such narrowness by its very design. Agencies and foundations have their distinct divisions tasked with promoting health, education, livelihoods, and so on. These are good goals per se, of course, and creating specialized organizations to pursue them makes some sense. But it also tends to result in a lot of powerful people asking relatively narrow questions about cost-effectiveness. They focus on the impacts on health or education or livelihoods—not all of them at once.

Whereas cash transfers focus on nothing in particular; they can be used for anything. This is why studies of cash transfers are particularly good at surfacing the tensions. For example, my co-authors and I recently studied a transfer scheme in the Indian state of Jharkhand, for example, whose stated aim was to reduce child malnutrition. We found that it did, to an extent. But (unsurprisingly) households also spend much of the money on things other than food for children—including food for adults. The program doesn’t look particularly cost-effective if you divide the effects on child anthropometrics by total costs. But this amounts to treating the other things as having absolutely no social value, which cannot be right.

How then can a cash research program engage with power, as it is currently structured? In (at least) two distinct ways: it can be pragmatic, or prophetic.

The pragmatic approach is simply to answer funders’ questions, such as they are. At GiveDirectly, for instance, we worked with one foundation whose funding came from a large coffee conglomerate and whose remit was therefore to help coffee farmers. For them the key question was what impacts transfers would have in coffee-growing regions, and on coffee production. We also worked with a foundation whose mandate was to serve women and girls; for them the key question was how transfers to young women making critical decisions about education, employment, fertility and marriage would affect those choices. In another instance, we worked with USAID to “benchmark” the impacts of their conventional programming, asking how giving away the same amount of money to the same kinds of people but with no strings attached would affect the same outcomes Congress had tasked it with shifting—outcomes like youth employment, for example.18

By taking these narrow objectives as given, these studies stacked the deck against cash transfers. We knew that recipients would almost surely spend some of the money on things that did not advance those objectives, and hence count for nothing in a cost-effectiveness analysis—things like food for adults in Jharkhand. Even so, transfers often ended up looking cost-effective.19 In such cases you could end up with de facto empowerment—funders choosing to transfer money without strings attached—without changing their underlying premise.

In the prophetic approach, research must be a bit provocative. Instead of asking how to achieve a given kind of success, it can offer to shed light on recipients’ notions of success.

Consider housing. Housing is a key asset for low-income households—shelter, after all, generally follows food on lists of existential needs. Development economists often omit housing from measures of well-being, as it is vexingly hard to value.20 But it surely matters. In relatively high-quality data from Indonesia, Mexico, and South Africa, for instance, my co-authors and I estimated that housing services represented between 22% and 43% of poor households’ consumption.

So it is no surprise that many GiveDirectly recipients have invested heavily in housing. They build new homes, or expand and upgrade existing ones. One popular choice is to replace a roof of thatch with one of sheet metal.21 This was so common, in fact, that it caught eyes at Habitat for Humanity, the leading house-building NGO. Upon meeting Habitat’s head, I was surprised that he thanked me for drawing so much attention to housing!

Photo from GiveDirectly; Jael, Kenya, 2018

I have no idea how this affected Habitat’s bottom line quantitatively. But the role research played here is striking. The usual technocratic logic would be

Donors want more housing (and believe it is more important than other things)

& Causal evidence shows that recipients use cash transfers to buy it

⇒ Donors fund more cash transfers.

while here it is

Recipients want more housing (and believe it is more important than other things)

& Causal evidence reveals this fact to donors

⇒ Donors fund more housing.

Evidence plays a role, but not to reveal how best to achieve donors’ priorities. Instead, it reveals what the recipients see as a priority.

This is why, in GiveDirectly studies, we typically pushed to measure a large set of outcomes. Larger, in particular, than the set of outcomes on the funder’s initial wish list. Measuring something—like investment in housing, say—makes visible the extent to which recipients are prioritizing it. The most important outcomes to measure, paradoxically, can be those that are not our priorities, but that could be theirs.

We can also extend this logic to choices not just about how to spend money, but also about how to receive it. I mentioned earlier one such study in which my co-authors and I learned that most people wanted lump sums, and not streams of small transfers. We also learned that timing mattered. A sizable minority preferred to defer their transfers for at least a month or two. They had various reasons, some of which we had not anticipated—to have more time to plan, to get money in the appropriate season for home-building, or at a time they would be free to start a new project, or at a time their neighbors would have money to spend at a new business, and so on. We learned a lot, in short, about the issues they were dealing with—much more so than had we tested which timing had a bigger effect on some ad hoc outcome index.

Normative choices in positive economics

Economists speak of maintaining a “positive / normative distinction” in research. Our vocation, in this view, is to describe “what is” —the positive—while others can then decide “what should be,” the normative. This idea has a stellar pedigree running back through Keynes (“the function of political economy is to investigate facts and discover truths about them, not to prescribe rules of life… It is described as standing neutral between competing social schemes”), Robbins (“economics is entirely neutral between ends”), and Friedman (“positive economics is in principle independent of any particular ethical position or normative judgments”), among other luminaries.

And to me, when I encountered it in graduate school, it seemed simplifying. It absolved me of any ethical responsibilities beyond honesty. Just the facts, ma’am.

The wrinkle is of course that one must decide which facts. This is obvious in the extremes. If I were to study how to breed infectious agents that could be used as biological weapons, I could hardly disclaim responsibility for the potential consequences on the grounds that the research is merely positive.22 Nor can one evade responsibility by appealing to what policy-makers want. Some of them have wanted biological weapons.

The truth is that economists make ethically meaningful choices all the time. In one recent study, for instance, my co-authors and I estimated effects of introducing biometric authentication into India’s largest social protection scheme. We found that corruption fell. We also found that between 1.5 million and 2 million legitimate beneficiaries lost access to their benefits at some point. Documenting either one of these results on its own would have been perfectly valid “positive” research. But it would have been ethically problematic, serving either the interests of the government or of its critics. And our own critics on the left might say that we made a misstep in studying this particular reform in the first place when we could instead have studied reductions in fraud achieved through other, less fraught means.

Or take the work on general equilibrium effects of transfers I mentioned earlier. In that paper we first estimate the economic multiplier on transfers, and then separately consider how it changed the welfare of recipients. This matters since, as Greg Mankiw and Matthew Weinzierl have pointed out, GDP and welfare are not the same thing. If people are induced to work more, for instance, this unambiguously raises GDP, but does so at the cost of leisure. Welfare thus rises less or perhaps not at all. From this point of view, it was normatively important to document that (in this case) GDP rose not primarily because people worked longer hours, but because they earned more per hour. All the more so because so much of the broader dialogue about cash transfers and labor supply has taken exactly the opposite ethical stance: that it would be bad if “lazy” recipients were to work less.23

This has been my broader point about the role of evidence: it matters what questions we ask. It mattered at GiveDirectly. It was pragmatically important that we address the understandable concerns holding many potential donors back—concerns that people living in poverty didn’t share their priorities, or didn’t know how to fish (or, at least, where to get fishing lessons). But it was also important to show that people living in poverty don’t always share their priorities, and that sometimes we were the ones being naïve about where and how to catch fish.

Paul Niehaus is Chancellor’s Associates Endowed Chair in Economics at the University of California, San Diego, and co-founder of GiveDirectly, Segovia, and Taptap Send.

If you have comments on this article, or wish to contribute to the discussion, please email them to letters@indevelopmentmag.com. Responses will be featured in a letters section.
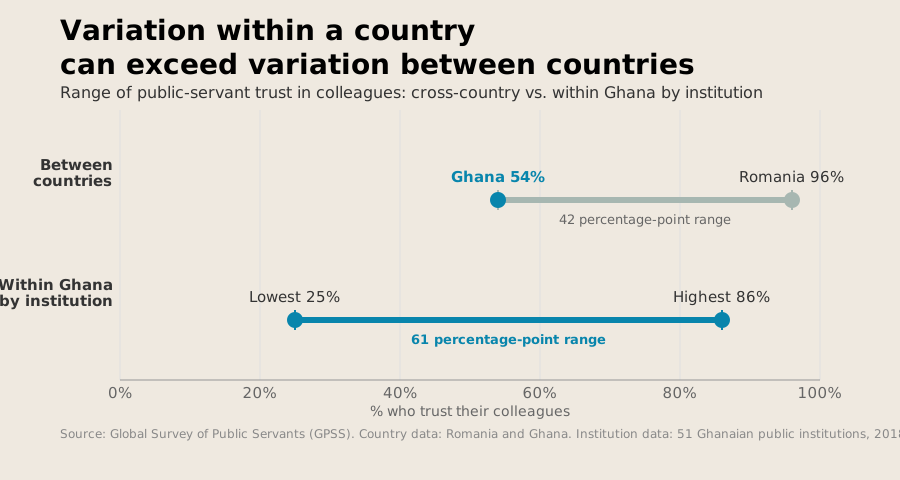
  1. The provenance of this phrase is murky, but Victorian novelist Anne Thackeray Ritchie is often credited. The irony is that when the inveterate skeptic Max Du Parc introduces it, in her novel Mrs. Dymond, he does so to critique the upper classes:

    “I don’t suppose even Caron could tell you the difference between material and spiritual,” said Max, shrugging his shoulders. “He certainly doesn’t practise his precepts, but I suppose the Patron meant that if you give a man a fish he is hungry again in an hour. If you teach him to catch a fish you do him a good turn. But these very elementary principles are apt to clash with the leisure of the cultivated classes. Will Mr. Bagginal now produce his ticket — the result of favour and the unjust subdivision of spiritual enjoyments?” said Du Parc, with a smile. (Source)
    ↩︎
  2. Predictably, as of February 2025, this page no longer exists. A Wayback Machine copy exists here. ↩︎
  3. Specifically, they gave $30B to charities classified as primarily working on international affairs. This is thought to be a lower bound on total giving to international development because a meaningful but unreported share of donations to religious organizations—which attracted $146B in 2023—eventually go to overseas work. ↩︎
  4. Many other NGOs run excellent unconditional cash transfer programs, but none promise that this is the sole thing they will do with your money. ↩︎
  5. These estimates may themselves be unfairly conservative to the extent that the subjective happiness of the rich and the poor reflects adaptation to their circumstances, as for example Sen (1988) has pointed out. ↩︎
  6. The marginal utility is 1/c; thus, the ratio of marginal utilities in income levels c1 over c2 is c2/c1. ↩︎
  7. There is arguably also a third, macroeconomic factor to account for. My co-authors and I have estimated, using a large-scale field experiment, that economies in rural Kenya grew by $2.50 for every $1 transferred into them. Multiplier estimates for the US tend to be lower, around $1.60. One might therefore reasonably factor in a “relative multiplier” adjustment of 2.5 / 1.6 ~= 1.6 or more. ↩︎
  8. The other two factors were (a) the advent of reliable, low-cost digital payments solutions like mobile money in low-income countries, and (b) our conversations with existing NGOs, which persuaded us they were unlikely to offer a direct transfer service as this would cannibalize existing business models. ↩︎
  9. We also had to find a location. Our initial idea had been to conduct the study near Busia, which had become a hotbed for RCTs after the pioneering early collaboration there between Michael Kremer (among others) and the NGO Investing in Children and their Societies (ICS). But Busia turned out to be too hot of a bed: so many other RCTs were running nearby that we could not find a place to work without stepping on someone’s toes, inadvertently cross-cutting their randomization or contaminating their control group. So we packed our bags and went elsewhere. ↩︎
  10. Answering it also required an unusually big experiment and novel analytical methods. See Muralidharan & Niehaus (2017) on the case for large-scale experimentation and Faridani & Niehaus (2024) on their use for estimating causal effects. ↩︎
  11. Subsequently several better-run trials in high-income countries have released results, including an exceptionally detailed one coordinated by Open Research (Bartik et al., 2024; Miller et al., 2024; Vivalt et al., 2024). ↩︎
  12. Economists and researchers who advocate randomized controlled trials as the gold standard for evaluating poverty reduction. ↩︎
  13.  In 2005 my co-founders and I finagled invitations to a kickoff event for the International Year of Microcredit at the United Nations. The mixed drinks were, as I recall, stronger than the evidence.

    ↩︎
  14. The word “empowerment” has been cheapened somewhat by over-use (see for example Jayakarani et al., 2012); here I will use it to refer narrowly to transfers of decision-making rights. One person is empowered only when another is disempowered—or, more to the point, chooses to disempower themselves. ↩︎
  15.  Casey (2018) is an excellent review of such programs. ↩︎
  16. A review of “participatory grantmaking” commissioned by the Ford Foundation found something similar: many examples in which beneficiaries were consulted, but few in which these consultations really bound the consultants in any way. ↩︎
  17. The more thoughtful cost-effectiveness analyses would, in fairness, try to account for the cost of health system capacity. But this is different from their value in alternative uses, which is what economics was built to study. ↩︎
  18. While straight-forward enough in concept, this took some vigorous machete-wielding by very brave and dedicated civil servants to pull off in practice. To give you some idea, they needed a memo from the General Counsel’s office providing legal cover; this ended up specifying that GiveDirectly would call each recipient to confirm that no one had spent taxpayer dollars on bad things—including birth control. ↩︎
  19. See, for example, the results from benchmarking studies in Rwanda (McIntosh & Zeitlin, 2022; 2024) and the Democratic Republic of the Congo (Javier et al., 2022). ↩︎
  20. See Amendola & Vecchi (2022). ↩︎
  21. See Haushofer & Shapiro (2016), Table VI. ↩︎
  22. This is more mechanical than the critique made by Blaug (1992) and Putnam (2002), among others, that a sharp dichotomy between “fact” and “value” may not exist in the first place. Even if you believe that purely factual statements are possible, it matters which ones you make. ↩︎
  23. See, for instance, Banerjee et al. (2017). ↩︎